2018 Nanaimo Market Recap
Single Family Prices and Volume
1,212 single-family homes were sold in 2018, down 24.5% from the 1,605 sold in 2017. The average sale price for a single-family home increased by over 7% to $556,820 from $518,449 a year earlier. While a 7% increase is still quite impressive, the pace of average price growth has decelerated from the previous 2 years where our market had experienced average sale price increases of 16% and 14% respectively. The median sell price, (which we rely upon as a secondary measure to gauge price action as it isn’t skewed by a few high priced homes selling at the top end of the market) for 2018 came in at $534,500, up 9% from $489,900 in 2017. This suggests more affordable homes at the low end of the market experienced more rapid price appreciation than homes priced at the higher end of the pricing spectrum.
What is also important to mention is that with such a notable drop in sales volume (24.5%), and active inventory levels throughout most of the year higher than they were in the same month in 2017, these pricing statistics are only reflective of what did sell. It does not tell the story of the increased number of homes that had listings expired by owners who overshot on their listing price and who were unwilling to price at a level that would have brought the buyer interest, and ultimately secured a sale. Had they priced accurately and sold at a lower price, the likely result would have been lower average price and median price increases. With such prominent media coverage of the shifting real estate market conditions in BC of late, it will be interesting to see if sellers’ expectations of their homes’ values increasingly start to come in line with what the market is telling them, translation: If you have been on the market for 3 months when the average days on market is 25, then you are overpriced.
Strength of the Trend
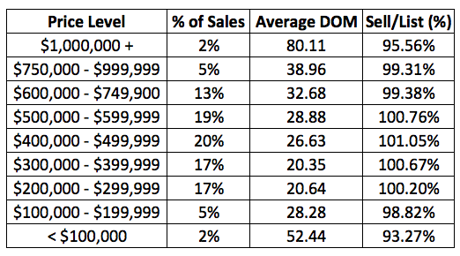
Factors we also look at when analyzing a market to validate its strength are sell/list ratio; sell price; days to sell, and current inventory numbers:
The sell/list ratio decreased year-over-year to 57% from 70%, suggesting a much lower percentage of homes listed are successfully finding a buyer, which roughly translates to approximately 43% of homes listed not selling. After a number of years of strong market conditions, for many sellers, it appears to have resulted in unrealistic expectations, or dare I say “greed” when pricing their homes. By historical standards, a sell/list ratio of 57% is still quite strong.
The sell price/list price remained constant at 99%. This doesn’t mean that all homes are going to sell for 99% of the list price, as this statistic is only reflecting the homes that did sell. If the approximately 43% of listings that didn’t find a buyer had in fact sold, they likely would have had to do so at less than the price they were asking, which would have resulted in a decreased sell price/list price ratio. Overall 99% reflects strong market conditions, however it should be noted that this figure represents the average for the year and as the year went on, this statistic deteriorated, with 3 of the past 4 months of 2018 coming in at 97%, after a first half that consistently saw this figure at either 99% or 100%.
The average number of days it took a home on the market to sell increased slightly in 2018 to 25 days, up from 24 in 2017. Again, by historical standards, this figure reflects strong market conditions and suggests that homes priced accurately continued to sell quickly throughout 2018.
The number of active listings as the calendar turned over was 256, 65 more than the 191 on the market at the end of 2017. What is interesting to note is that 2018 actually saw 160 less single-family homes hit the market than in 2017. With the end of the calendar year occurring in the midst of the holiday season and winter weather conditions that often deter sellers from having their homes on the market, it is important to look at the inventory from another angle to get a better idea of how much choice buyers had throughout the year. With that in mind, the average number of active listings at the end of the month troughout the year was 318, up nearly 15% from the average of 278 in 2017, suggesting that overall, buyers had more homes to choose from in 2018 than in 2017.
Top Performing Neighbourhoods & Categories
In 2018, all but one of the sub-areas defined by the real estate board in Nanaimo experienced a price increase, however, the weight of the increase varied significantly depending on the sub-area. Of these, 5 experienced double-digit average price increases, including top performer Pleasant Valley at 19.74%, followed by Old City, Departure Bay, Diver Lake, and Central Nanaimo. South Jinglepot was the outlier, with the average price decreasing 8.19%. Digging a little deeper into market activity in South Jinglepot you would discover that in 2017, South Jinglepot was actually the top performing sub-area in Nanaimo, with an average price increase of 28.7%, so it is not a huge surprise to see a bit of a correction here after such an acceleration.
Something that is important to remember when looking at real estate markets is despite the headlines, not all neighbourhoods are moving in the same direction all the time. With real estate being location specific, it is vital to know what is going on in your area when determining whether the timing may be right to sell your home. For buyers, neighbourhoods will experience differing price action throughout the cycle. Again, it pays to know what is happening in each sub-area, to determine whether a purchase would be prudent.
However, price alone does not tell the story of a market as volume also has to be taken into consideration. Of the 18 sub-areas in Nanaimo, only 2 experienced volume increases, North Jingle Pot and Diver Lake. On the opposite end of the spectrum, the 5 areas that saw the most pronounced drop in sales volume were Cedar, South Jinglepot, Uplands, Hammond Bay, and Brechin Hill.
By category, on declining volume, lots were the top performing category with the average lot sale price increasing 22% in 2018. When looking at lots as a category, you should be cautious to read too much into these figures as lot supply is often limited to a few large developments in town, so depending on where those are, the average lot prices will be significantly influenced. Looking at other categories, condo apartments slightly outpaced patio homes (2017’s top performer by category), up 32%, followed by single-family homes, townhouses, and waterfront homes, which were the only category to see average prices decline in 2018.
Patio home sales volume was up 53%, signaling continued strength, whereas all other categories experienced declining sales numbers.
Forecast
Be sure to check out our 2019 Forecast, scheduled for release within the next few days, for our take on what is to come in the year ahead.
How’d we do on our 2018 Forecast? See for yourself… Here are some of our insights (in bold) shared back in January of 2018:
Demand:
Beyond the first quarter, the number of new listings hitting the market will play a factor in determining how long it will take to satisfy the pent-up demand that currently exists before markets revert to more balanced conditions. Result: after a fairly strong spring, markets have trended more towards balanced conditions.
We see (that) the number one headwind the Nanaimo housing market currently faces is (that) the largest block of our population is the baby boomers, many of whom are now empty nesters living in the 3,000+ square foot homes they bought in the $200,000 - $300,000 range a decade ago, that are now valued well beyond the grasp of the average household in town based on income qualification. Result: The demand for homes above $750,000 dissipated in 2018, with 243 listings expiring without a sale, up from 133 in 2017. The number of homes selling above $750,000 also dropped despite rising average prices in Nanaimo, down to 194 from 225 in 2017.
Where we do see sustained demand over the next decade is for low-maintenance, stratified properties catering to local empty nesters entering retirement and those increasingly seeking out Central Vancouver Island as their retirement destination of choice. Result: Despite volume decreases across all other categories, patio home sales volume was up 53% in 2018, with average prices increasing 10.13%.
Supply:
Overall, we see inventory levels slightly elevated from 2017 numbers, while subdued inventory levels and outright greed may keep sellers who should be considering listing on the sidelines in hopes of the market continuing to creep higher. Result: For single-family homes, the average number of active listings throughout 2018 was 15% higher than in 2017.
Looking out longer term, the coming years will likely see a significant supply of 3,000+ square feet homes hitting the market as empty nesters downsize to reduce expenses and housekeeping square footage to enjoy retirement. Increased supply without increasing demand at these price points puts downward pressure on pricing. Result: While this is a longer-term prediction, market activity in 2018 showed the impact of this is already starting to take hold. In 2017, 265 homes over 3,000 sqft sold in Nanaimo, with 101 listings expiring. Last year, the sales volume dropped to 199, with 169 listings expiring without a buyer.
(Longer term) the supply of ground-oriented patio homes, condos, and low maintenance detached single story homes is likely to be insufficient to meet the needs of the downsizers. As such, the gap is likely to close, with a premium being paid for housing options well suited for seniors, while larger family and executive homes will likely become more affordable relative to incomes in the coming years. Result: Despite volume decreases across all other categories, patio home sales volume was up 53% in 2018, with average prices increasing 10.13%.
Interest Rates:
Given macroeconomic conditions across the country, we see the prime lending rate gradually increasing throughout 2018, with the first hike as early as this month based on solid economic numbers of late. The consensus among economists is that we are likely to see three .25% rate hikes this year, which we feel is a reasonable forecast. Result: The Bank of Canada increased the overnight lending rate .25% three times.
Government Intervention:
(Federally), we are expecting the Government will take a wait-and-see approach, evaluating how recent intervention will impact the market, with many analysts predicting the housing market will cool nationally in 2018. If conditions nationally do cool, government intervention is not likely to have a major impact in 2018. Result: Markets nationally did cool, and federal government intervention did not have a major impact in 2018.
Closer to home, there has been talk that continued strength in BC could see the 15% foreign buyer tax implemented in areas outside of the Lower Mainland. While we saw the Vancouver market largely rebound after the cooling that immediately occurred when this tax was brought in back in 2016, the impact would likely be greater in smaller centers where many foreigners have been buying higher end real estate to avoid this tax. Result: The foreign buyer tax was implemented outside of the Lower Mainland, and the impact was significant, largely reducing the number of foreign buyers entering our market.
Other Markets:
For buyers coming from out of town, Nanaimo is always being compared to other markets and affordability plays a huge role here. The Greater Vancouver market is really the “straw that stirs the drink” in our provincial housing market... if the Lower Mainland was to be hit by a more serious correction, a ripple effect is likely to impact Vancouver Island communities, which would no longer be as attractive from an affordability standpoint relative to Vancouver. Result: The Greater Vancouver market was hit by a more serious correction with significant volume decreases and buyer demand from the Lower Mainland cooled.
Opportunities
The primary opportunity we see in 2018 remains undoubtedly on the sell side. Buyer demand is still quite strong, the sell/list ratio is high, days on market is low, and competition about 30% of the time is driving transaction prices above the asking price and likely beyond market value. Markets can turn quickly, while we don’t know how much further this market cycle has to run, we do know conditions are solid currently and trying to time a top is a recipe for disaster. Result: Markets conditions have shifted to more balanced conditions, with a lower percentage of homes listed selling and inventory levels rising.
Current market conditions present a solid opportunity for those looking to downsize in the coming years to lock-in their recent gains. We have already started to see increasing demand for properties well suited to senior living, such as patio homes (prices up 32% in 2017), ranchers, etc., and we expect this trend to continue in the coming years. With this being the case, we see price appreciation is more likely in these categories of housing than others, so 2018 may present a good opportunity for those empty nesters in larger homes to transition to their retirement home at a reasonable price point before prices continue to be bid up to an unreasonable level. Result: Sales volume for larger homes at the higher end of the pricing spectrum dropped, while patio home sales volume was up 53%.
In our view, given the rapid price acceleration in recent years, it may be prudent for investors to take some money off the table to move into other markets that appear to have more immediate upside potential, or in a worst-case scenario, to limit exposure to a possible market correction in years to come. Result: So far, it appears the best of this market cycle is likely behind us. While there are no major signs of impending doom, the significant volume drops in other major markets, mortgage lending growth reaching the lowest level in years, and an increasing supply of purpose-built rental apartment units make Nanaimo less attractive as a real estate investment destination, as it is still very difficult to find cash flowing property without a significant down payment, and the prospects for continued above-average appreciation are not great for the foreseeable future.
For developers, we see the best opportunity in developments catering to the aging, downsizing population. Low-maintenance, ground-oriented, stratified properties with higher-end finishings, enough room for family to visit, and plenty of storage for all that “stuff” should garner strong demand. Single detached ranchers, and lifestyle properties in close proximity to golf courses and marinas should also be well received. Result: Despite volume decreases across all other categories, patio home sales volume was up 53% in 2018, with average prices increasing 10.13%.
With shifting market conditions, real estate is once again in the headlines. Be cautious with whose information you are relying upon to guide your real estate decisions.
All the best for 2019!
250.751.0804 | info@jahelkagroup.com | www.jahelkagroup.com
Source: VIREB