
Market Conditions Stable in March, But Are Conditions Turning?
Single Family Prices and Volume
101 single family homes sold in March, up almost 19% from the 85 sold in February, but down by over 34% from the 154 that sold in the same timeframe last year. The average home price decreased marginally from February’s average of $551,961 to $551,392 although this is an almost 10% increase from last March when the average home price was $502,696. The median sale price also decreased slightly to $537,500 from February’s all-time high of $545,000, however, this is still a 12% increase from last March’s median sale price of $479,900. If you have been following our commentary, including our 2018 forecast, you will be familiar with our expectations that we should see strong demand in to the spring market to satisfy pent-up 2017 demand, with supply levels ultimately determining how long it will take to satisfy it, which in turn, directly corresponds to the amount of upward pressure on pricing we see from buyers. While not unexpected as we transition into the Spring market, the 193 homes listed in March represented a 38% increase over February, but a 3.5% decrease from the 200 listed in March of 2017.
Strength of the Trend
Factors we also look at when analyzing a market to validate its strength are sell/list ratio; sell price; days to sell, and current inventory numbers:
The sell/list ratio continued to decrease in March, coming in at 52%, down 14.75% from 61% in February, and down over 32% from 77% in March of 2017. A possible explanation for this is that Sellers are increasingly listing properties with unrealistic price expectations. While accurately priced properties are selling quickly, in many cases in multiple offers and well above the asking price, those who continue to test the market at unsupported price levels are having discouraging listing experiences.
The sell price/list price remained constant at 100% in March which is not suggesting every home is selling at 100% of the asking price as it is just an average, with some selling well below asking, and the most attractively priced offerings going into multiple offer situations and selling above the list price in many cases. For a general frame of reference, typically anything 96-97% and above reflects strong market conditions.
The average days on the market decreased to 20 days, from 30 in February, which is also a 20% decrease on the 25 average days on the market from March of last year. Further to the comments in the paragraph above, overpriced homes are going to sit on the market for longer. While the average single-family home price actually decreased slightly, many properties continued to be listed at unsupported price levels in anticipation of further price advances that the market has grown accustomed to over the past 3 years. While it is important for sellers not to leave money on the table, more often than not, the best chance to maximize your return is to price accurately thus maximizing buyer interest when the home initially hits the market. Price too high and you will limit your number of potential buyers, and your chances at a strong initial offer or even a bidding war leading to a sale above the asking price.
As of the end of March, the number of active listings is 272, up over 29.5% from February, and 11% from inventory levels at the same time last year. This appears to be a positive for buyers, as more inventory means more choice and hopefully less competition. Lack of supply has been a key factor in the rapid price increases we have seen. Should the number of active listings continue to rise, expect to see more balanced market conditions in the coming months.
Top Performing Neighbourhoods & Categories
15 of the 18 sub-areas defined by the real estate board in Nanaimo saw an increase in the average selling price (trailing 12 months) from February to March, with all 18 experiencing increased prices year-over-year. When looking at these neighbourhood figures, it is important to note that we use trailing 12-month figures to limit volatility caused by lower transaction volumes in some neighbourhoods, where a few high priced or low priced transactions could tremendously skew results. A trailing 12 figure will always be slower to react than simple month-over-month, so that is why the results here are not going to be as pronounced as the figures used in the stats we report above. Moving on, these annual increases range from 8.11% in North Nanaimo to 23.28% in South Jingepot. Top risers month-over-month were Lower Lantzville, Brechin Hill, and Uplands. Top performers year-over-year were once again South Jinglepot, Uplands, Upper & Lower Lantzville, University District, and Central Nanaimo. Looking at volume, risers both monthly and annually included Hammond Bay, Old City, and Diver Lake. Similar to last month, we continue to see a wide-ranging assortment of price and volume top performers than we have experienced over the course of this market cycle. Initially, we had in-demand areas such as North Nanaimo, Hammond Bay, and Departure Bay continually outperforming, then as affordability increasingly became a challenge in these areas, areas that were historically more affordable began to outperform. More recently, the general trend has been a prominence of neighbourhoods on the outskirts of the city experiencing strong price action. This past month, again, throw a few darts at a map, as there doesn’t seem to be any rhyme or reason.
On low volume, lots were the top performing category in March, followed by townhomes, and patio homes, while apartment-style condos, single family (water), and single family homes were all down month-over-month, though all categories were up year-over-year.
Only Found Here
We took a look at the residential market (all categories included) for the first quarter of 2018, and here are the findings:
Days on Market:
- Selling in 0 - 7 days: 47% at an average of 101.78% of the list price in an average of 2.91 days.
- Selling in 8 -31 days: 27% at an average of 99.13% of the list price in an average of 16.51 days.
- Selling in more than 31 days: 25% at an average of 98.15% of the list price in an average of 84.9 days.
Sell Price/List Price:
- Sold above list price: 35% sold above the asking price - at an average of 3.69% above ask, with 22.61% the highest premium paid. The average days on market for those selling above the asking price was 10.06.
- Sold at the list price: 18% of homes sold at the asking price in an average of 10.37 days.
- Sold below the list price: 46% of homes sold, taking an average of 39.46 days.
Sales by Price Level:
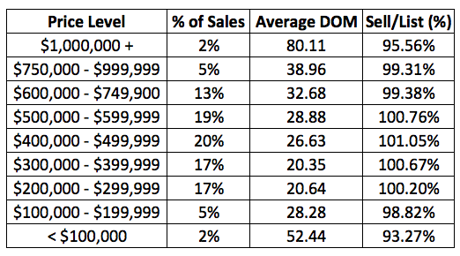
There are clearly some key takeaways here:
I. The majority of properties sold at or above the asking price.
II. The average premiums paid when homes sell above the asking price are less than what we were seeing during the spring market.
III. Unless sold very quickly (representative of the most attractive listings priced accurately), properties are taking longer to sell, as properties that didn’t sell within the first month took an average of 84.9 days to sell.
IV. There is a noticeable inverse relationship between days on market and sell/list ratio. In general, the lower the days on the market, the higher the price relative to list price. Homes selling well below the asking price (that were overpriced by greedy sellers with unrealistic expectations) are sitting on the market for a significant amount of time as the seller’s expectations normalize over time.
V. Demand is strongest in the $200,000 to $600,000 range where 73% of transactions occurred, supported by a sell/list ratio above 100% and a lower average days on market (DOM).
VI. Sales volume above $750,000 is subdued, with only 7% of the transactions in this range, with a sell/list ratio below the market average, and a higher average days on market.
What this means for Buyers: For properties priced between $200,000 - $600,000, demand remains strong, with bidding wars still a common occurrence. However, above this price point more sales are occurring below the asking price, so there look to be more opportunities to find a home without competition and potentially finding a “deal” under the asking price. By historical standards, properties are still selling quickly, so if you are a serious buyer, it is still important to be pre-approved for a mortgage and very clear on what you are looking for so that you can offer immediately on the best new options hitting the market.
What this means for Sellers: Below $600,000, buyer demand is strong. Above $600,000 demand is not as strong as it once was, necessitating the need to price accurately to maximize interest. For the last number of months, sellers have been caught up in the hype and media attention on the housing market and in many cases are still going to market with unrealistic expectations. This is not the “leave a little room for negotiation” market. Pricing accurately will minimize the days on market (and inconvenience to your family), as well as best position you for a competitive offer or ideally a multiple-offer situation. As you can see above, the longer a home sits on the market, the more likely it is to transact below the listing price as the listing becomes stale. Working with a Realtor with a very strong marketing platform is vital, however, pricing accurately has never been more important, so make sure the Realtor you select has a proven track record of pricing accurately and with average days on the market well below the market average.
Opportunities
Looking at the first quarter results, there is no doubt that affordability challenges primarily driven by more stringent mortgage qualification requirements are having an impact on the market. While demand remained strong, more than 80% of residential sales transacted below the $600,000 mark. People are simply not qualifying for as much as they were previously, lowering demand at higher price points. This is no surprise as the market has experienced significant price appreciation for the last number of years, and as we have suggested in past market recaps, we believe the market has reached a point where continued price appreciation is no longer sustainable due to these affordability concerns. In our 2018 Forecast, we discussed how, based on CMHC’s Affordability Calculator, the average household income in Nanaimo would qualify for a mortgage of $284,237. The qualifying rate and mortgage rates have increased since we ran this scenario. Therefore the qualification amount would be reduced, while the average home price in March came in at $551,392. We consider this divergence concerning, and the expectation is interest rates will continue to rise over the next few years, which will continue to constrain mortgage qualification amounts.
So what does all this mean for buyers and sellers? Well, under the $600,000 mark, demand is as strong as ever, so if you are a buyer in this price range, unfortunately, we don’t have any good news...yet.
Above $600,000 the days on market are higher, sales volumes are down, and the sell/list ratio is revealing that there is starting to be some room for negotiations. If you have been following our commentary, and more specifically our annual forecasts the last couple of years, you may remember us expressing a concern about where the demand for the 3,000+ square foot homes was going to come from given the demographics trends, affordability challenges, and consumer preferences. If you didn’t see this past January’s annual forecast, it went something like this: “... the number one headwind the Nanaimo housing market currently faces is the largest block of our population is the baby boomers, many of whom are now empty nesters living in the 3,000+ square foot homes they bought in the $200,000 – $300,000 range a decade ago, that are now valued well beyond the grasp of the average household in town based on income qualification. This leads us into the consideration of demand for different asset classes. With the aging population, it is no secret that baby boomers now becoming empty nesters will be looking to downsize in the coming years. However, selling their 3,000+ square foot homes requires buyers, buyers require financing, and buyers will likely not be qualified to finance the homes coming onto the market at higher price points. You know where this is going…” Well, 3 months later and a neighbourhood we know very well, the newer section of the Eaglepoint neighbourhood consisting of 3,000+ square foot homes, primarily built after 2000 in a prime north end location close to shopping, schools, restaurants, beaches, parks, and amenities, and we have 9 active listings with an average time on market of 42 days (4 of which are 56 days or more) and 0 sales. 2017 during the same period, 7 sales, with an average days on market of 6.7 days. Don’t tell me the market isn’t changing... So what happens when homes aren’t moving? Sellers start to adjust prices downward or become more open to negotiating. Long story short, if you are looking at $750,000 plus, your chances of finding a deal are increasing. Beyond $1,000,000, with an average sell price/list price ratio of 95.56% and an average of 80 days on the market so far this year, your chances of being able to avoid competition and negotiate a reasonable price are much improved.
With that said, depending on your investment strategy and price point, this spring may present a good opportunity for investors to take some money off the table in anticipation of cooling market conditions or even a market correction in years to come. Taking the opportunity to lock in your gains and diversify into other asset classes or move into other markets that appear to have more upside potential may not be a bad idea.
We are by no means suggesting that now is the time to sell for everyone, as individual circumstances differ, as do investment objectives, etc. Remember, we all need a place to live and over time real estate generally appreciates. We just know there are peaks and valleys and we have reason to believe we are closer to the peak than the valley.
For a consultation specific to your situation, or if you have any questions about market conditions, please contact us at info@jahelkagroup.com and we would be happy to help.
Check out the Nanaimo Market Statistics Here: Market Statistics March 2018
Source: VIREB