Oct. 4, 2019

Nanaimo Market Statistics September 2019

Depressed Sales Volume Remains the Story in September


Single Family Prices and Volume

91 single-family homes sold in September, 1 more than the 90 that sold in August, and 7 fewer than what sold in September of last year. The average home price was up 3.7% in September to $569,667 from August’s average of $549,622. However, September’s average was still 2% less than reported last September when the average home price was $582,115. The median sale price increased marginally from $537,500 in August to  $539,000 in September. Again, this figure is down 2.3% from the same time frame last year when the median sale price was $551,700. 188 homes were listed in September, which was 12% more than the 168 homes listed in August, and almost 10% more than the 171 reported as being listed in September of 2018.

Insights: After 3 consecutive months on the decline, the average home price rebounded reasonably in September. However, on a year-over-year basis, we are still below where the average home price was for the same time period last year. The average home price continues to be fairly range-bound, a trend that has persisted since early 2018, coinciding with a time period when we started to really notice a decrease in sales volume. Over the past 20 months or so, this range-bound average price has fluctuated between a low of $532,299 (November 2018) and a high of $593,326 (May 2019). It seems it is a few months up, a few months down, as the market has failed to gain any significant traction one way or another. This is consistent with the notion that we are trending towards a more balanced market, and the market is in a bit of a consolidation pattern after a few years of sustained upward pressure on pricing. 

Low sales volume continues to be the major story heading into fall of 2019. While there was 1 more home sale than we had in August, by historical standards September is generally a fairly busy month in the market, as people return to routines as summer comes to a close. In comparison to last year, there were 7% fewer sales in September, but this doesn’t tell the whole story as the 98 sales in September of 2018 was down significantly from the 152 and 158 homes that sold in September of 2017 and 2016, respectively. In the past 12 months, there have been 17% fewer sales than in the preceding 12 months, which was itself down 13% from the 12 months before that. Single-family homes are not the only category feeling the slowdown...On a trailing-12 basis, acreage sales are down 29%, apartment sales are down 29%, patio homes are down 10%, townhomes are down 7%, half duplexes are down 31%, mobile homes are down 16%. 

Last month we commented that volume was possibly starting to stabilize after following a general trend downwards for much of 2018 and early 2019. We may have spoken too soon, as once again volume is off by a noticeable amount, down 16% month-over-month, and 25% from August of last year. When you look at the total sales volume for the past 12 months in comparison to the preceding 12 months, volume is down 20%. Looking at year-to-date figures, so far in 2019, there have been 768 single-family home sales, which is down 12% from the 871 that sold from January 1 to August 31 of 2018. So with single-family down 20% and 12% on a trailing 12 month and year to date basis, respectively, you may be wondering how does this decreased volume compare to other categories of residential real estate? Here are the trailing 12 and year-to-date  figures: Apartment style condo volume is -29% / -23%, patio homes are -14% / -21%, and townhomes are -11% / +2%. The category that is a bit surprising is lots, which are up 25% / 26%. 

Something we have been keeping a close eye on now for a number of months is the sales volume at the higher end of the market. So far there are 7 registered sales of homes over $800k in Nanaimo, including 2 over $1,000,000.  

With 129 homes currently on the market priced at $800k plus, this would equate to more than 18 months of supply. While finding quality options priced competitively below $600k has remained challenging, the higher end of the market is continuing to experience elevated inventory levels, which we continue to believe at some stage is going to result in downward pricing pressures at various price points. If this does eventually materialize, we believe the lower end of the market is still relatively well supported based on buyer demand, so we don’t anticipate that buyers with budgets up to $500k are likely to see much better options in their price range.  Above this price range, you would think that a trickle-down effect will likely occur to some extent. Considering that there are 129 homes currently on the market priced above $800k and very few are selling each month, it would be reasonable to make the assumption that if sellers do eventually want to sell they will have to lower their prices to levels where buyers have the budgets to afford and desire to pay the price that is being asked. For example, if the homes priced around $800k have to drop to $750k for volumes to start to normalize, then you now have more supply at $750k for buyers to choose from. When that happens, the least attractive options in the $750k range have to adjust their prices downward to find their demand, and so on and so forth. At some stage, this should reach a point of equilibrium where buyer demand and seller supply are more in sync at various price points. When this happens and the excess supply has been absorbed, then the market should be poised for more sustainable price/volume movements than we are currently seeing. 

So how did Nanaimo stack up against other Island communities north of Victoria for the month of September? Looking at the average price, Nanaimo, down 2% year-over-year, was the only decliner. Comox Valley and Cowichan Valley lead the way, both up 15%, followed by Campbell River where the average price jumped 12%, Port Alberni up 8% and Parksville/Qualicum up 7%.  

Looking at volume, Nanaimo declining 7% didn’t see quite the volume slowdown that Campbell River and Port Alberni did, down 19% and 9%, respectively. However, Nanaimo fell short of the results in Parksville/Qualicum which saw volume spike 33% from last September. Comox Valley saw volume rise 4%, while the Cowichan Valley was up 2%. Looking at the entire Vancouver Island Real Estate Board totals, the average sale price was up 8% while volume was down 1% from September of 2018.


Strength of the Trend

Factors we also look at when analyzing a market to validate its strength are sell/list ratio; sell price; days to sell, and current inventory numbers:

The sell/list ratio decreased to 48% in September, down from 54% in August, and down 15.8% from September of 2018 when the ratio was 57%. 

The average sell price/list price decreased to 96% in September down from 98% in August and from 97% in September of last year. 

The average days on the market for the homes that did sell in September increased by 41.7% to  34 days from August’s 24 days, which is over 9.7% higher than September of last year when days on market averaged at 31.

As of the end of September, the number of active listings was 373, up just over 1% from August’s 368 active listings, and 2.5% from the same time last year when there were 364 active listings at month-end.

Insights: As you are likely well aware, statistics can be used to help support whichever point you are trying to make. For example a 3.7% increase in average sale price on its own...very positive. A decline of 2% from last September...not great, but not of huge concern. What is more concerning is that when we look beyond average pricing, for the first time this cycle 8 of 8 market indicators that we look at in this section deteriorated.  While Nanaimo has fared quite well relative to other markets, these indicators coupled with the fact that we were the only major community north of Victoria on the island to see prices decline year-over-year, suggest that our reasonable fortune through what is hopefully the depths of the market slowdown in BC, has possibly started to catch up with us.  With that said, 1 month’s results never tell the whole story and with the fluctuation month to month, we continue to believe that these inconsistent figures and volatility is consistent with a market that continues to transition to more of a balanced overall market from the strong sellers’ market we have experienced for the past number of years. By and large, the numbers we are seeing by historical standards are still quite respectable. 


Top Performing Neighbourhoods & Categories

9 of the 18 sub-areas defined by the real estate board in Nanaimo saw an increase in the average selling price (trailing 12 months) from August to September, with 10 of the 18 also experiencing increased prices year-over-year. When looking at these neighbourhood figures, it is important to note that we use trailing 12-month figures to limit volatility caused by lower transaction volumes in some neighbourhoods, where a few high priced or low priced transactions could tremendously skew results. A trailing 12 figure will always be slower to react than simple month-over-month, so that is why the results here are not going to be as pronounced as the figures used in the stats we report above. Moving on, these year-over-year average price changes range from -17.93% in Brechin Hill, the bottom performer for the sixth month running, to 12.57% in Diver Lake.  The top riser month-over-month was Upper Lantzville with South Jinglepot the second highest. Top performers year-over-year were Diver Lake, Hammond Bay, Cedar, and South Nanaimo.  Looking at volume,  5 of the 18 sub-areas saw increases month-over-month with Upper Lantzville and Chase River coming in as the top risers, while only two neighbourhoods, (Pleasant Valley and Departure Bay), saw increases year-over-year.

Insights: Difficult to draw any significant conclusions here. Some neighbourhoods are up, some are down, with seemingly no particular rhyme or reason. If I had to speculate on why the Brechin Hill neighbourhood has been underperforming, I would suggest it is a neighbourhood that attracts a lot of attention from out-of-town buyers given its close proximity to the seawall, downtown, ferries and seaplane terminals, as well as offering some pretty exceptional views at an affordable price.  With buyer demand from out-of-town buyers noticeably slower than it was in years past, there simply isn’t the upward pressure on pricing that we were seeing. 

Single-family homes, apartment-style condos, townhouses, and lots were the categories that saw an increase in average sale price from August to September, with apartment-style condos, townhouses, and lots also experiencing increases from September of last year. Month-over-month increases in sales volume were only reported in single-family homes, townhouses, and lots, while patio homes, townhouses, and lots were the only categories to experience year-over-year increases.

Insights:  Again, not much for meaningful conclusions to be drawn as these figures continue to fluctuate from month to month, and categorically there are not really any trends or patterns we are observing, which we interpret as suggesting we are in more of a consolidation phase where the market is taking a breather after a steady run-up. 


Opportunities 

For the past number of months, there has been very little new to report in this section of our recap. From our perspective, we see overall, that so far in 2019 the market has continued to trend towards more balanced market conditions. 

While we don’t have a crystal ball, we see that in the coming years if inventory levels remain elevated at higher price points, at some stage motivated sellers are going to adjust their pricing expectations to secure a sale. We anticipate that there will be somewhat of a ripple effect, where we are going to see more value at various price points than we are seeing now. While we don’t foresee average prices correcting much if at all, in the coming year or two, what we do see is that dollars may stretch further and buyers will be able to buy nicer homes at more affordable prices than they can today. 

The true unknown variable here that may lead to this not coming to pass is the unknown future buyer demand at the higher end of the market. We don’t see that the local population has the qualifying incomes to support the absorption of the listings for sale at the higher end of the market, and the volume increase we’d expect in the coming years as aging baby boomers look to downsize. Therefore, market conditions at the higher end of the market are largely dependent on demand from out-of-town buyers, and their demand is largely dependent on the confidence they have to purchase in our market, which is largely determined by the market conditions in their own local markets where they are reading the headlines in the newspaper and reported on the local news. The lower mainland market has been showing signs of life, and continued strength will likely position those looking to exit mainland life with the opportunity to do so, as once again mainland sellers are finding buyers for their homes, which paves the way for them to buy into the Vancouver Island dream at cents on the dollar, relative to home prices in Vancouver.

On that note, where do we see opportunities for buyers? Well looking at single-family homes, for the time being for the few buyers out there looking at higher-end homes, we’d still caution you to take your time as the equivalent of 18 months of inventory provides you with plenty of choice and likely some negotiating room if you can find a realistic seller.  While undoubtedly the higher end of the market will rebound and regain its upward ascent at some point, as touched on above, until buyers with deep enough pockets to afford the higher-priced homes start to absorb the excess inventory, short term market conditions at the higher end of the market are likely to remain relatively subdued. Until we are reporting otherwise, take your time and be selective, while looking for signs of a motivated seller and you just may find what proves in time to have been a great buy of a higher-end home. 

Another category we are keeping our eyes on is apartment-style condos, where the market seems to have cooled quickly. If you read out 2019 Market Forecast, in particular, the “Supply” section, we highlighted some concerns we had with the volume of new construction of condo units scheduled to hit the market at what we feel is the tail end of this cycle. Some notable stats for apartment-style condos in September (in comparison to September of 2018) read as follows: New listings up 116%, active inventory up 229%, days on market for those that did sell up 81%, sales volume down 10%, list/sell ratio down to 20%. To say the least, this isn’t painting an overly rosy picture for the condo market in the foreseeable future, especially as the glut of condo inventory scheduled to hit the market over the next few years is just starting to be listed. In our opinion, the condo market is likely to get worse before it gets better. Not great for sellers… Certainly likely to create a decent opportunity for buyers. 

While sellers of higher-end homes may have missed the top of this market cycle, life circumstances will continue to drive sellers to list their homes. With an elevated supply of higher-priced listings currently on the market and fewer buyers, it is all the more vital that the home is priced accurately and competitively to maximize exposure when interest is the highest. So if you are listing, selecting a Realtor with a strong marketing platform and an active approach to marketing your home is becoming increasingly important. While we went through a period for the last few years where a For Sale sign and an MLS listing were enough to entice buyers to write an offer (definitely not our approach), in this market that haphazard approach is simply not going to cut it. 

For investors, on the buy side, patience is going to be rewarded. If you are considering an income property, our take is that currently you are still likely best served by looking at other markets or waiting it out as there is no way you are going to cash flow on a leveraged purchase. Given what we have outlined above, at this point in the market cycle, we would not recommend speculating on further price appreciation with a negative cash flow property in this market. For multi-family investors, cap rates are at historic lows and therefore valuations at all-time highs. Factoring in the significant number of purpose-built rental apartment buildings currently in the development permitting or building permitting stage, the increased supply of rental units in the coming years is going to potentially put downward pressure on rental rates, and push up vacancy rates which are already starting to increase. While expectations are that further interest rate hikes are likely on hold for the foreseeable future, rates are still below historic norms, it would be a reasonable assumption that at some point over the next few years we will continue the climb to a more normalized interest rate environment. When that happens, eventually cap rates will likely start to see a similar increase towards more normalized levels. Without the upward pressure on rents, this is setting the stage for decreasing values. We’ve not exactly described the ideal conditions for investment. 

Remember, over time real estate generally appreciates. We just know there are peaks and valleys. Buy on the way to the peak and you are positioning yourself for success, buy on the way to the valley, not so much. It is our mandate to provide you with information that you can use to determine which side of the peak we are on, and ultimately to help you make informed decisions that you will not regret. 

For a consultation specific to your situation, or if you have any questions about market conditions, please contact us at info@jahelkagroup.com and we would be happy to help.


Check out the Nanaimo Market Statistics Here: Market Statistics September 2019

Source: VIREB


Sept. 4, 2019

Nanaimo Market Statistics August 2019


Sales Volume and Average Prices Continue to Fall in August


Single Family Prices and Volume

90 single-family homes sold in August, 19 less than the 109 sold in July, and 20 fewer than reported as sold in August of last year. The average home price decreased by 0.8% in August to $549,622, from July’s average of $554,240, which is also 3% less than reported last August when the average home price was $566,795. The median sale price decreased by 4% to $537,500 in August from July’s $560,000, however it is still 1.6% higher than the same time frame last year when the median sale price was $529,000. 168 homes were listed in August, which was 11% less than the 189 homes listed in July, but 5.7% more than the 159 listed in August of 2018.

Insights: For the third month in a row the average sale price was down month-over-month, and once again the year-over-year results are also showing a negative figure. With an average sale price of $549,622, we are now back below the figures the market experienced in February of 2018. Since that time, the average price has been fairly range-bound,  fluctuating between a low of $532,299 (November 2018) and a high of $593,326 (May 2019). It seems it is a few months up, a few months down, as the market has failed to gain any significant traction one way or another. This is consistent with the notion that we are trending towards a more balanced market, and the market is in a bit of a consolidation pattern after a few years of sustained upward pressure on pricing. Given what is occurring in other markets, Nanaimo has fared remarkably well. 

Last month we commented that volume was possibly starting to stabilize after following a general trend downwards for much of 2018 and early 2019. We may have spoken too soon, as once again volume is off by a noticeable amount, down 16% month-over-month, and 25% from August of last year. When you look at the total sales volume for the past 12 months in comparison to the preceding 12 months, volume is down 20%. Looking at year-to-date figures, so far in 2019, there have been 768 single-family home sales, which is down 12% from the 871 that sold from January 1 to August 31 of 2018. So with single-family down 20% and 12% on a trailing 12 month and year to date basis, respectively, you may be wondering how does this decreased volume compare to other categories of residential real estate? Here are the trailing 12 and year-to-date  figures: Apartment style condo volume is -29% / -23%, patio homes are -14% / -21%, and townhomes are -11% / +2%. The category that is a bit surprising is lots, which are up 25% / 26%. 

With 126 homes currently on the market priced at $800k plus, this would equate to 14 months of supply. While finding quality options priced competitively below $600k has remained challenging, the higher end of the market is continuing to experience elevated inventory levels, which we continue to believe at some stage is going to result in downward pricing pressures at various price points. If this does eventually materialize, we believe the lower end of the market is relatively well supported based on buyer demand, so we don’t anticipate that buyers with budgets up to $500k are likely to see much better options in their price range.  Above this price range, you would think that a trickle-down effect will likely occur to some extent. Considering that there are 126 homes currently on the market priced above $800k and very few are selling each month, so if sellers do eventually want to sell they will have to lower their prices to levels where buyers have the budgets to afford and desire to pay the price that is being asked. For example, if the homes priced around $800k have to drop to $750k for volumes to start to normalize, then you now have more supply at $750k for buyers to choose from. When that happens, the least attractive options in the $750k range have to adjust their prices downward to find their demand, and so on and so forth. At some stage, this should reach a point of equilibrium where buyer demand and seller supply are more in sync at various price points. When this happens and the excess supply has been absorbed, then the market should be poised for more sustainable price/volume movements than we are currently seeing. 

Something we have been keeping a close eye on now for a number of months is the sales volume at the higher end of the market. So far there are 9 registered sales of homes over $800k in Nanaimo, including 3 over $1,000,000, and Nanaimo’s highest price sale of the year (eclipsing the previous high figure by more than $1,000,000) at $2,625,000 for a beautiful waterfront home ideally situated on Sabastion Beach in Lower Lantzville.  

So how did Nanaimo stack up against other Island communities north of Victoria for the month of August? Looking at the average price, Nanaimo down 3% year-over-year was joined on the negative side of the ledger by Parksville/Qualicum down less than 1% from last year and Port Alberni, down 6% from August of last year. On the positive side, Campbell River and Cowichan Valley lead the way, posting year-over-year increases of 10%, while Comox was up 2%. It is interesting to note that Nanaimo’s average sale price of $549,622 is now below Parksville/Qualicum ($608,200), Comox Valley ($567,530), and the Cowichan Valley ($559,544).

Looking at volume, Nanaimo down 25% from August of 2018 was the biggest decliner. The Cowichan Valley was down 22%, Campbell River was down 15%, Parksville Qualicum was down 6%,  Comox Valley up 1%, while Port Alberni volume was up 24%. Looking at the entire Vancouver Island Real Estate Board totals, the average sale price was up 1% while volume was down 11% from July of 2018.

Strength of the Trend

Factors we also look at when analyzing a market to validate its strength are sell/list ratio; sell price; days to sell, and current inventory numbers:

The sell/list ratio decreased to 54% in August, down from 58% in July, and down 28% from August of 2018 when the ratio was 75%. 

The average sell price/list price increased to 98% in August up from 97% in both July and August of last year. 

The average days on the market for the homes that did sell in August decreased by 9 days from July to 24, which is over 29% lower than August of last year when days on market averaged at 34.

As of the end of August, the number of active listings was 368, down 5% from July’s 388 active listings, and 2.9% less than at the same time last year when there were 379 active listings at month-end.

Insights: Difficult to draw any significant conclusions here. Some neighbourhoods are up, some are down, with seemingly no particular rhyme or reason. If I had to speculate on why the Brechin Hill neighbourhood has been underperforming, I would suggest it is a neighbourhood that attracts a lot of attention from out-of-town buyers given its close proximity to the seawall, downtown, ferries and seaplane terminals, as well as offering some pretty exceptional views at an affordable price.  With buyer demand from out-of-town buyers noticeably slower than it was in years past, there simply isn’t the upward pressure on pricing that we were seeing. Hammond Bay as the top performer for the third consecutive month is another interesting case. Historically, Hammond Bay has been one of the most desirable neighbourhoods in Nanaimo and that was evident earlier in this cycle when prices soared. However, it stands to reason that you could describe this area as almost having been a victim of its own success, where home prices essentially climbed out of reach of the vast majority of buyers, and while the area continued to post year-over-year average price gains consistently, the percentage increases started to trail those being registered in other, more affordable  areas for a period of time. Interestingly, since January of 2016 when we started tracking, Hammond Bay has not had a year-over-year average price decline, one of only 5 of the 18 sub-areas (South Nanaimo, Chase River, Central Nanaimo, Diver Lake being the others) that can stake this claim. Hammond Bay’s return to prominence is indicative of the fact that as other neighbourhoods in less desirable areas saw their average prices continue to climb and the gap closed between the average prices in these neighbourhoods and Hammond Bay, Hammond Bay is once again being appreciated by the market for the lifestyle it affords and some of the most impressive ocean views the city has to offer. 

Insights: When considering both month-over-month and year-over-year figures, 6 of the 8 market indicators have improved, with 2 of 8 deteriorating. While this is positive, when you factor in declining average prices and declining sales volume, it is becoming more and more of a challenging market to decipher. However, we continue to believe that these inconsistent figures and the month-to-month volatility we are seeing here is consistent with a market that continues to transition to more of a balanced overall market from the strong sellers’ market we have experienced for the past number of years. By and large, the numbers we are seeing by historical standards are still quite respectable. 

Top Performing Neighbourhoods & Categories

11 of the 18 sub-areas defined by the real estate board in Nanaimo saw an increase in the average selling price (trailing 12 months) from July to August, with 11 of the 18 also experiencing increased prices year-over-year. When looking at these neighbourhood figures, it is important to note that we use trailing 12-month figures to limit volatility caused by lower transaction volumes in some neighbourhoods, where a few high priced or low priced transactions could tremendously skew results. A trailing 12 figure will always be slower to react than simple month-over-month, so that is why the results here are not going to be as pronounced as the figures used in the stats we report above. Moving on, these year-over-year average price changes range from -12.92% in Brechin Hill, the bottom performer for the fifth month running, to 13.25% in Hammond Bay, the top performer for the third consecutive month.  The top riser month-over-month was South Jinglepot with Diver Lake the second highest. Top performers year-over-year were Hammond Bay, Diver Lake, Cedar, South Nanaimo, and the University District. Looking at volume, 6 of the 18 sub-areas saw increases month-over-month with Chase River, Brechin Hill, and Lower Lantzville coming in as the top risers, while only two neighbourhoods, (Pleasant Valley and North Jinglepot), saw increases year-over-year.

Single-family waterfront homes, (on low volume), and patio homes were the only categories to see an increase in average sale price from July to August, while all categories, with the exception of single-family homes and townhomes, experienced increases from August of last year. Month-over-month increases in sales volume were only reported in apartment-style condos and lots, which were the only categories to experience year-over-year increases.

Insights:  You can’t read much into the increase in the average price for waterfront homes as volume is simply too low to draw any meaningful conclusions. Aside from this, again not much for meaningful conclusions to be drawn as these figures continue to fluctuate from month to month, and categorically there are not really any trends or patterns we are observing, which we interpret as suggesting we are in more of a consolidation phase where the market is taking a breather after a steady run-up. 

Opportunities 

For the past number of months, there has been very little new to report in this section of our recap. From our perspective, we see overall, that so far in 2019 the market has continued to trend towards more balanced market conditions. 

While we don’t have a crystal ball, we see that in the coming years if inventory levels remain elevated at higher price points, at some stage motivated sellers are going to adjust their pricing expectations to secure a sale. We anticipate that there will be somewhat of a ripple effect, where we are going to see more value at various price points than we are seeing now. While we don’t foresee average prices correcting much if at all, in the coming year or two, what we do see is that dollars may stretch further and buyers will be able to buy nicer homes at more affordable prices than they can today. 

On that note, where do we see opportunities for buyers? Well, we have noted that the lower end of the single-family market has remained relatively strong, so we don’t see a lot of opportunities here currently. For buyer’s looking at higher-end homes, we’d caution you to take your time as seller sentiment still seems overly optimistic that the current slowdown is still just a hiccup on a further trek upwards in pricing. While undoubtedly the higher end of the market will rebound and regain its upward ascent at some point, until buyers with deep enough pockets to afford the higher-priced homes start to absorb the excess inventory, market conditions at the higher end of the market are likely to remain relatively subdued for the foreseeable future. Until then, take your time and be selective, while looking for signs of a motivated seller and you just may find what proves in time to have been a great buy of a higher-end home. 

For investors, on the buy side, patience is going to be rewarded. If you are considering an income property, our take is that currently you are likely best served by looking at other markets or waiting it out as there is no way you are going to cash flow on a leveraged purchase. Given what we have outlined above, at this point in the market cycle, we would not recommend speculating on further price appreciation with a negative cash flow property in this market. For multi-family investors, cap rates are at historic lows and therefore valuations at all-time highs. Factoring in the significant number of purpose-built rental apartment buildings currently in the development permitting or building permitting stage, the increased supply of rental units in the coming years is going to potentially put downward pressure on rental rates, and push up vacancy rates which are already starting to increase. While expectations are that further interest rate hikes are likely on hold for the foreseeable future, rates are still below historic norms, it would be a reasonable assumption that at some point over the next few years we will continue the climb to a more normalized interest rate environment. When that happens, eventually cap rates will start to see a similar increase towards more normalized levels. Without the upward pressure on rents, this is setting the stage for decreasing values. We’ve not exactly described the ideal conditions for investment. 

Remember, over time real estate generally appreciates. We just know there are peaks and valleys. Buy on the way to the peak and you are positioning yourself for success, buy on the way to the valley, not so much. It is our mandate to provide you with information that you can use to determine which side of the peak we are on, and ultimately to help you make informed decisions that you will not regret. 

While sellers of higher-end homes may have missed the top of this market cycle, life circumstances will continue to drive sellers to list their homes. With an elevated supply of higher-priced listings currently on the market and fewer buyers, it is all the more vital that the home is priced accurately and competitively to maximize exposure when interest is the highest. So if you are listing, selecting a Realtor with a strong marketing platform and an active approach to marketing your home is becoming increasingly important. While we went through a period for the last few years where a For Sale sign and an MLS listing were enough to entice buyers to write an offer (definitely not our approach), in this market that haphazard approach is simply not going to cut it. 

For a consultation specific to your situation, or if you have any questions about market conditions, please contact us at info@jahelkagroup.com and we would be happy to help.

Check out the Nanaimo Market Statistics Here:  Market Statistics August 2019.

Source: VIREB

Aug. 8, 2019

Nanaimo Market Statistics July 2019


AVERAGE SALE PRICE DOWN IN JULY, SALES VOLUME APPEARS TO BE STABILIZING 


Single Family Prices and Volume

109 single-family homes sold in July, 3 less than the 112 sold in June, and the same number as reported as sold in July of last year. The average home price decreased by 4.5% in July to $554,240 from June’s average of $580,330, which is also just under 2% less than reported last July when the average home price was $565,388. The median sale price decreased by 2.6% to $560,000 in July from June’s $574,888 which is 3.7% higher than the same time frame last year when the median sale price was $539,900. 189 homes were listed in July, which was 1% less than the 191 homes listed in June, and 17.5% less than the 229 listed in July of 2018.

Insights: For the second month in a row the average sale price was down month-over-month, and for the 3rd time in 2019, the year-over-year results are also showing a negative figure. With an average sale price of $554,240, we are now back close to the figures the market experienced back nearly a year and a half ago in early 2018. Since that time, the average price has been fairly range-bound,  fluctuating between a low of $532,299 (November 2018) and a high of $593,326 (May 2019). It seems it is a few months up, a few months down, as the market has failed to gain any significant traction one way or another. This is consistent with the notion that we are trending towards a more balanced market, and the market is in a bit of a consolidation pattern after a few years of sustained upward pressure on pricing. Given what is occurring in other markets, Nanaimo has fared remarkably well. 

Looking at volume, we have noticed that the declining figures appear as though they may be starting to stabilize. The combined sales volume for the past 3 months (May - July) is actually up 1 unit (357) from the 356 homes that transacted in the same period last year. In contrast, the first 4 months of the year (January - April) experienced a combined decrease in volume of more than 18% from the same period last year. Is it a coincidence that the last prices have been down the last couple months but sales volume seems to have bucked the declining trend downwards? It is likely too early to tell...however, if you have been following our commentary, you will likely be aware that our take is that sales volume is likely to normalize back towards historical averages when sellers start to get more realistic with their pricing expectations realizing a market shift is underway and price more in line with where demand is from buyers. While it’s too early to draw any conclusions, we’ll be keeping a close eye on price/volume action moving forward.

Something we have been keeping a close eye on now for a number of months is the sales volume at the higher end of the market. After a bit of a resurgence in April and May and following up on a step back down in June, so far there have only been 6 sales registered of homes over $800k in July. With 143 homes currently on the market priced at $800k plus, this would equate to nearly 2 years of supply. While there continues to be very little supply below $600k, the higher end of the market is continuing to experience elevated inventory levels, which we continue to believe at some stage is going to result in downward pricing pressures at various price points. If this does eventually materialize, we believe the lower end of the market is relatively well supported based on buyer demand, so we don’t anticipate that buyers with budgets up to $500k are likely to see much better options in their price range.  Above this price range, you would think that a trickle-down effect will likely occur to some extent. Considering that there are 143 homes currently on the market priced above $800k and very few are selling each month if sellers do eventually want to sell they will have to lower their prices to levels where buyers have the budgets to afford and desire to pay the price that is being asked. For example, if the homes priced around $800k have to drop to $750k for volumes to start to normalize, then you now have more supply at $750k for buyers to choose from. When that happens, the least attractive options in the $750k range have to adjust their prices downward to find their demand, and so on and so forth. At some stage, this should reach a point of equilibrium where buyer demand and seller supply are more in sync at various price points. When this happens and the excess supply has been absorbed, then the market should be poised for more sustainable price/volume movements than we are currently seeing. 

So how did Nanaimo stack up against other Island communities north of Victoria for the month of July? Looking at the average price, Nanaimo down 2% year-over-year was only underperformed by Parksville/Qualicum, down 3%. Port Alberni and Campbell River which are historically more affordably priced had year over year increases of 11%. Cowichan Valley was up 10%, with the Comox Valley up 7%. What is interesting to note is that if you look back to 1 year ago, the 2 highest priced zones at that time have declined, while the 2 lowest priced zones are showing double-digit year-over-year returns. Based on these figures, the gap between lowest to highest priced communities has now closed from 94% to 69%. If we had to speculate on what is happening here, the perceived value at various price points is higher in the more affordable communities from out-of-town buyers choosing Vancouver Island as their retirement destination of choice. Looking at volume, Nanaimo (which was unchanged from a year ago), was outpaced by a 40% spike in volume in Port Alberni and a 39% increase in the Comox Valley. Campbell River was down 15%, while the Cowichan Valley and Parksville/Qualicum were down 8%. While the volume change figures may seem sizeable, it is important to remember that these are smaller communities, so a fairly small numerical change can result in a more pronounced percentage change. Looking at the entire Vancouver Island Real Estate Board totals, the average sale price was up 4% while volume was up 3% from July of 2018.

Strength of the Trend

Factors we also look at when analyzing a market to validate its strength are sell/list ratio; sell price; days to sell, and current inventory numbers:

The sell/list ratio decreased to 58% in July,  which is up almost 21% from July of 2018 when the ratio was 48%.  

The sell price/list price remained constant at  97% for a second month in July. At this point, we are not able to report on the movement from July 2018, as there appears to be an error in the data provided by the real estate board, which has not been corrected by the time of publication. 

The average days on the market increased by 3 days to 33 in July, which is over 43% higher than July of last year when days on market averaged at 23. 

As of the end of July, the number of active listings was 388, down 1% from June’s 392 active listings, and over 12% less than at the same time last year when there were 442 active listings at month-end.

Insights: When considering both month-over-month and year-over-year figures, 3 of the 7 market indicators we are able to report on this month in this section have improved, 3 have deteriorated, and 1 remains unchanged. These figures and the month-to-month volatility we are seeing here is consistent with a market that continues to transition to more of a balanced overall market from the strong sellers’ market we have experienced for the past number of years. By and large, the numbers we are seeing by historical standards are still quite respectable. 

Top Performing Neighbourhoods & Categories

11 of the 18 sub-areas defined by the real estate board in Nanaimo saw an increase in the average selling price (trailing 12 months) from June to July, with 10 of the 18 also experiencing increased prices year-over-year. When looking at these neighbourhood figures, it is important to note that we use trailing 12-month figures to limit volatility caused by lower transaction volumes in some neighbourhoods, where a few high priced or low priced transactions could tremendously skew results. A trailing 12 figure will always be slower to react than simple month-over-month, so that is why the results here are not going to be as pronounced as the figures used in the stats we report above. Moving on, these year-over-year average price changes range from -8.17% in Brechin Hill, the bottom performer for the fourth month running, to 15.38% in Hammond Bay for the second consecutive month.  The top riser month-over-month was Diver Lake with Uplands the second highest. Top performers year-over-year were Hammond Bay, Diver Lake, South Nanaimo, Cedar, and Central Nanaimo.  Looking at volume,  7 of the 18 sub-areas saw increases month-over-month with Pleasant Valley and the University District coming in as the top risers for a second month, while only three neighbourhoods, (North Jingle Pot, Pleasant Valley, and Departure Bay), saw increases year-over-year.

Insights: Difficult to draw any significant conclusions here. Some neighbourhoods are up, some are down, with seemingly no particular rhyme or reason. I’d suggest the results here are simply reflective of a market trending more towards balanced conditions. 

Single-family waterfront homes, (on low volume), and apartment-style condos were the only categories that saw an increase in average sale price from June to July, while all categories with the exception of single-family homes experienced increases from July of last year. Month-over-month increases in sales volume were reported in all categories aside from single-family homes and year-over-year increases in all categories except apartment-style condos.

Insights:  You can’t read much into the increase in the average price for waterfront homes as volume is simply too low to draw any meaningful conclusions. The impressive month-over-month and year-over-year increases in average condo (apartment-style) prices are not a huge surprise given affordability concerns that continue to have an impact, especially on the single-family market. 

Opportunities 

For the past number of months, there has been very little new to report in this section of our recap. From our perspective, we see overall, that so far in 2019 the market has continued to trend towards more balanced market conditions. However, the key term here is “overall”, as, within the overall local market, we continue to see some fragmentation or noticeable variances among price brackets and categories. The general trend over the past number of months, when you zoom in on different price ranges for single-family homes, is that there has been some noticeable disparity amongst price ranges. Again, while we don’t like to generalize, you could look at the sub-$600k range as still being very much a seller’s market as long as the home is priced reasonably. The $600k - $800k range is more balanced, but trending towards a buyer’s market at the higher end of the range, while the $800k + range, with nearly 2 years of supply based on last month’s absorptions numbers, would be considered in buyer’s market territory.  

The lower end of the market is still overheated, as affordability constraints of local buyers and a subdued supply of listings in this price range has created a competitive market in this price range. If you are a homeowner or investor thinking about selling your home priced below $600k - $650k, with the lack of suitable options for buyers and still strong demand, you have a great opportunity to sell into strength. While we don’t have a crystal ball, we see that in the coming years if inventory levels remain elevated at higher price points, at some stage motivated sellers are going to adjust their pricing expectations to secure a sale. We’d anticipate that there will be somewhat of a ripple effect, where we are going to see more value at various price points than we are seeing now. While we don’t foresee average prices correcting much, if at all, in the coming year or two, what we do see is that dollars will likely stretch further and buyers will be able to buy nicer homes at more affordable prices than they can today. 

On that note, where do we see opportunities for buyers? Well, we have noted that the lower end of the single-family market has remained relatively strong, so we don’t see a lot of opportunities here currently. Looking at the past months’ absorption figures we see a noticeable trend, as implied months of supply in the $600 - 700k range is currently only 2.7 months, so again, not a lot of opportunities as we are trying to identify where buyers may be motivated for price concessions. In the $700 - $800k range, implied supply jumps noticeably to 16 months, $800k - $1,000,000 is also elevated at 15 months, while with 66 homes currently on the market over $1,000,000 in Nanaimo and only 1 registered sale in July in this price range, the implied supply is 66 months. As inventory levels rise with minimal absorption, there has to be a few motivated sellers out there getting increasingly anxious and who may be ripe for reasonable price concessions. For buyer’s looking at higher-end homes, we’d caution you to take your time as seller sentiment still seems overly optimistic that the current slowdown is still just a hiccup on a further trek upwards in pricing. While undoubtedly the higher end of the market will rebound and regain its upward ascent at some point, until buyers start to absorb the excess inventory, market conditions at the higher end of the market are likely to remain relatively subdued for the foreseeable future. Until then, take your time and be selective, while looking for signs of a motivated seller and you just may find what proves in time to have been a great buy of a higher-end home. 

While sellers of higher-end homes may have missed the top of this market cycle, life circumstances will continue to drive sellers to list their homes. With more listings currently on the market and fewer buyers, it is all the more vital that the home is priced accurately and competitively to maximize exposure when interest is the highest. So if you are listing, selecting a Realtor with a strong marketing platform and an active approach to marketing your home is becoming increasingly important. While we went through a period for the last few years where a For Sale sign and an MLS listing were enough to entice buyers to write an offer (definitely not our approach), in this market that haphazard approach is simply not going to cut it. 

For investors, on the buy side, patience is going to be rewarded. If you are considering an income property, our take is that currently you are likely best served by looking at other markets or waiting it out as there is no way you are going to cash flow on a leveraged purchase. Given what we have outlined above, we would not recommend speculating on further price appreciation with a negative cash flow property in this market. For multi-family investors, cap rates are at historic lows and therefore valuations at all-time highs. Factoring in the significant number of purpose-built rental apartment buildings currently in the development permitting or building permitting stage, the increased supply of rental units in the coming years is going to potentially put downward pressure on rental rates, and push up vacancy rates which are already starting to increase. While expectations are that further interest rate hikes are likely on hold for the foreseeable future, rates are still below historic norms, it would be a reasonable assumption that at some point over the next few years we will continue the climb to a more normalized interest rate environment. When that happens, eventually cap rates will start to see a similar increase towards more normalized levels. Without the upward pressure on rents, this is setting the stage for decreasing values. We’ve not exactly described the ideal conditions for investment. 

Remember, over time real estate generally appreciates. We just know there are peaks and valleys. Buy on the way to the peak and you are positioning yourself for success, buy on the way to the valley, not so much. It is our mandate to provide you with information that you can use to determine which side of the peak we are on, and ultimately to help you make informed decisions that you will not regret. 

For a consultation specific to your situation, or if you have any questions about market conditions, please contact us at info@jahelkagroup.com and we would be happy to help.

Check out the Nanaimo Market Statistics Here:  Market Statistics July 2019


Source: VIREB


July 9, 2019

Nanaimo Market Statistics June 2019

First Half of 2019 Marked by Continued Volume Slowdown


Single Family Prices and Volume

112 single-family homes sold in June, 24 less than the 136 sold in May, and 4 more than the 108 that were reported as sold in the same timeframe last year. The average home price decreased by 2.19% in June to $580,330 from May’s average of $593,326, however, this is still over 4% higher than reported last June when the average home price was $556,879. The median sale price decreased by a fraction to $574,888 in June from May’s $575,000 which is 9.3% higher than the same time frame last year when the median sale price was $525,900. 191 homes were listed in June, which was 20% less than the 240 homes listed in May, and 18.4% less than the 234 listed in June of 2018.

Insights: Nothing overly notable to comment on here. Transaction volume remains subdued, as does the number of new listings. Lack of supply has been a bit surprising but is certainly helping to keep our pricing figures looking fairly strong in Nanaimo, despite what is happening in other markets. While buyer demand is down, at the lower end of the pricing scale there are just so few homes being listed that when homes do come up they go very quickly and there continues to be upward pressure on pricing.

If you have been following our commentary, you will recall that earlier this year the theme seemed to be that the sub-$600k category continued to be quite competitive, while the higher end of the market (which we had defined as $800k+) in Nanaimo had experienced a noticeable slowdown with active listing numbers starting to climb fairly steadily. However, the last couple of months we reported the $800k+ market had started to show some signs of life. So far we have only 5 June sales registered over $800k, a noticeable slowdown from the 16 in May. There are currently 141 homes priced above $800k on the market in Nanaimo, which is up from 128 at the end of May. Based on June’s absorption, this equates to 28.2 months of supply. While there continues to be very little supply below $600k, the higher end of the market is continuing to experience elevated inventory levels, which we continue to believe at some stage is going to result in downward pricing pressures at various price points.

So what are the factors driving the volume slowdown? In our opinion, there are a few factors at work here. Firstly, it is important to note that the reality is local buyers continue to face affordability constraints and there are just not enough homes at price levels to be absorbed by the market that local buyers can afford. A second contributor to the slowdown is that in higher-priced neighbourhoods, sellers are likely still referencing what their neighbours sold for in 2017 or 2018 and using these figures to anchor their opinion of value, as opposed to recognizing that conditions are shifting and there is more choice for buyers at higher price points with less buyer demand, so pricing competitively is increasingly more important if there is motivation to sell. Thirdly, we are seeing less out-of-town buying for a few reasons. Slowdowns in other markets are resulting in some nervousness from buyers, price declines in other markets while our market has remained relatively resilient is closing the “value gap”, where buyers can no longer to the same extent cash out on their mainland property and buy a much more impressive home in this area and pocket the rest for a rainy day. Further, the foreign buyer and speculation taxes have both served to reduce out-of-town buyer demand. Taken together, it doesn’t appear that volumes will be significantly picking up any time soon.

So how did Nanaimo stack up against other Island communities north of Victoria for the month of June? Looking at the average price, Nanaimo up 4% year-over-year was only eclipsed by Port Alberni/West Coast up 25% (on low volume). Coming in behind Nanaimo, but still in positive territory were Campbell River and the Cowichan Valley, both up 3%. The Comox Valley was down 1%, but more notable was Parksville/Qualicum, which was down 6%. Volume wise, Nanaimo up 4% and Cowichan Valley up 1% were the only zones to see an increase. Port Alberni saw volume fall 31% from the same month last year, Parksville/Qualicum was down 15%, Campbell River was down 9%, and the Comox Valley was down 4%. Looking at the entire Vancouver Island Real Estate Board totals, the average sale price was up 4% while volume was down 7% from June of 2018.

Strength of the Trend

Factors we also look at when analyzing a market to validate its strength are sell/list ratio; sell price; days to sell, and current inventory numbers:

The sell/list ratio increased to 59% in June, which is up over 28% from June of 2018 when the ratio was 46%.

The sell price/list price decreased to 97% in June after four consecutive months at 98%, which is down from June 2018 when it was 99%.

The average days on the market increased by 6 days to 30 in June, which is 50% higher than June of last year when days on market averaged at 20.

As of the end of June, the number of active listings was 392, up almost 3% from May’s 381 active listings, but 2.5% less than at the same time last year when there were 402 active listings at month end.

Insights: When considering both month-over-month and year-over-year figures, 3 of 8 market indicators in this section improved and 5 deteriorated. These figures and the month-to-month volatility we are seeing here is consistent with a market that continues to transition to more of a balanced overall market from the strong sellers’ market we have experienced for the past number of years. By and large, the numbers we are seeing by historical standards are still quite respectable.

Top Performing Neighbourhoods & Categories

10 of the 18 sub-areas defined by the real estate board in Nanaimo saw an increase in the average selling price (trailing 12 months) from May to June, with 11 of the 18 also experiencing increased prices year-over-year. When looking at these neighbourhood figures, it is important to note that we use trailing 12-month figures to limit volatility caused by lower transaction volumes in some neighbourhoods, where a few high priced or low priced transactions could tremendously skew results. A trailing 12 figure will always be slower to react than simple month-over-month, so that is why the results here are not going to be as pronounced as the figures used in the stats we report above. Moving on, these year-over-year average price changes range from -7.65% in Brechin Hill, the bottom performer for the third month running, to 14.32% in Hammond Bay. The top riser month-over-month for the second-month running was Hammond Bay with Central Nanaimo the second highest. Top performers year-over-year were Hammond Bay, Cedar, South Nanaimo, Pleasant Valley, and Diver Lake. Looking at volume, 7 of the 18 sub-areas saw increases month-over-month with Pleasant Valley and the University District coming in as the top risers, while only two neighbourhoods, (North Jingle Pot and Upper Lantzville), saw increases year-over-year.

Insights: Difficult to draw any significant conclusions here. Some neighbourhoods are up, some are down, with seemingly no particular rhyme or reason. I’d suggest the results here are simply reflective of a market trending more towards balanced conditions.

Apartment-style condos and lots were the only categories that saw an increase in average sale price from May to June, while all categories with the exception of single-family waterfront homes experienced increases from June of last year, but this should be taken with a grain of salt as only 2 waterfront homes sold in June, so the low volume of transactions does not provide an overly accurate picture of the category. No categories reported month-over-month increases in sales volume, while single-family homes and lots did experience increases year-over-year.

Insights: Again, struggling to draw any meaningful conclusions here along category lines. From month to month, there has not been a lot of consistency with top performing categories. This lends further support to the belief that we are trending towards more balanced market conditions. The month over month volume decreases are not a huge surprise as May typically tops the charts as the highest volume month of the year, so a step down in June was somewhat expected.

Opportunities

For the past number of months, there has been very little new to report in this section of our recap. From our perspective, we see overall, that so far in 2019 the market has continued to trend towards more balanced market conditions. However, the key term there is “overall”, as, within the overall local market, we continue to see some fragmentation or noticeable variances among price brackets and categories. The general trend over the past number of months, when you zoom in on different price ranges for single-family homes, is that there has been some noticeable disparity amongst price ranges. Again, while we don’t like to generalize, you could look at the sub-$600k range as still being very much a seller’s market as long as the home is priced reasonably. The $600k - $800k range is more balanced, but trending towards a buyer’s market at the higher end of the range, with the $800k + range with approximately 28 months of supply based on last month’s absorptions numbers would be considered in buyer’s market territory.

The sub-$600k market is still overheated, as affordability constraints of local buyers and a subdued supply of listings in this price range has created a competitive market in this price range. If you are a homeowner or investor thinking about selling your home priced below $600k - $650k, with the lack of suitable options for buyers and still strong demand, you have a great opportunity to sell into strength. While we don’t have a crystal ball, we see that in the coming years if inventory levels remain elevated at higher price points, at some stage motivated sellers are going to adjust their pricing expectations to secure a sale. We’d anticipate that there will be somewhat of a ripple effect, where we are going to see more value at various price points than we are seeing now. While we don’t foresee average prices correcting much, if at all, in the coming year or two, what we do see is that dollars will likely stretch further and buyers will be able to buy nicer homes at more affordable prices than they can today. When you have 2,000 square foot 60s and 70s homes in marginal areas on the verge of needing $50,000 worth of work to replace all the majors (windows, roof, furnace, etc.) listed above $500,000, we don’t see that as sustainable, as Nanaimo household income levels simply won’t be able to support it. The only reason sellers are getting away with this so far this year is that there is limited supply at this price and lots of buyers. When the homes that are not moving at higher prices start to be priced more competitively (if they do) and become competition, these homes will eventually have to be priced more attractively to move. The other important factor is that if prices start to come down and the masses become fearful that prices could be declining, those fearful of a falling may list their homes to limit their downside risk. The result of this is increasing inventory, more choice for buyers and the weaker options at a given price point will need to adjust their pricing to remain competitive. In summary, if you are thinking about selling a home that may need a fair amount of work or that isn’t in the most ideal location, sell into strength - strong buyer demand and limited inventory, don’t wait until inventory levels pick up and buyers have more choice and room to negotiate, as is starting to happen at high price levels.

On that note, where do we see opportunities for buyers? Well, with 141 homes priced above $800k currently on the market, there has to be a few motivated sellers out there getting increasingly anxious and who may be ripe for reasonable price concessions. For buyer’s looking at higher end homes, we’d caution you to take your time as seller sentiment is still optimistic that the current slowdown is still just a hiccup on a further trek upwards in pricing. However, upon further examination, when you start looking at what has caused the higher end of the market to stall out, our take is that there is a reasonable likelihood conditions get worse before they get better, so some patience from buyers is likely going to be rewarded. So you may be wondering what has caused the higher-end market to stall out? Here is our take… On the demand side, the cooling lower mainland market and intensified media coverage of the slowdown is making lower mainland buyers fearful of buying, and the foreign buyers’ tax and speculation tax has nearly killed demand from foreign buyers. When you look at the origin of buyers of higher priced homes at the peak of this cycle, much of it was mainland and foreign buyers who had the income levels to finance or the cash required to purchase these higher priced properties. When you remove the out-of-town buyers, local buyers simply can’t support the current price levels. Looking at the supply side, contributing to what we feel will be some pain here is the fact that increasingly you have the largest block of our population (aging baby boomers) who are living in these $800,000+ homes and are looking to downsize in the coming years. This will likely only lead to an increase in the supply of homes priced towards the top end of the market, as Nanaimo income levels will not qualify buyers for financing to absorb the increased supply of homes coming on the market. Until we see substantial renewed demand from out-of-town buyers with deep pockets, this should result in even more choice and negotiating strength for buyers at the higher end of the market.

While sellers of higher-end homes may have missed the top of this market cycle, life circumstances will continue to drive sellers to list their homes. With more listings currently on the market and fewer buyers, it is all the more vital that the home is priced accurately and competitively to maximize exposure when interest is the highest. So if you are listing, selecting a Realtor with a strong marketing platform and an active approach to marketing your home is becoming increasingly important. While we went through a period for the last few years where a For Sale sign and an MLS listing were enough to entice buyers to write an offer (definitely not our approach), in this market that haphazard approach is simply not going to cut it.

For investors, on the buy side, patience is going to be rewarded. If you are considering an income property, our take is that currently you are likely best served by looking at other markets or waiting it out as there is no way you are going to cash flow on a leveraged purchase. Given what we have outlined above, we would not recommend speculating on further price appreciation with a negative cash flow property in this market. For multi-family investors, cap rates are at historic lows and therefore valuations at all-time highs. Factoring in the significant number of purpose-built rental apartment buildings currently in the development permitting or building permitting stage, the increased supply of rental units in the coming years is going to potentially put downward pressure on rental rates, and push up vacancy rates which are already starting to increase. While expectations are that further interest rate hikes are likely on hold for the foreseeable future, rates are still below historic norms, so it is likely that at some point over the next few years we will continue the climb to a more normalized interest rate environment. When that happens, eventually cap rates will start to see a similar increase towards more normalized levels. Without the upward pressure on rents, this is setting the stage for decreasing values. We’ve not exactly described the ideal conditions for investment.

Remember, over time real estate generally appreciates. We just know there are peaks and valleys. Buy on the way to the peak and you are positioning yourself for success, buy on the way to the valley, not so much. It is our mandate to provide you with information that you can use to determine which side of the peak we are on, and ultimately to help you make informed decisions that you will not regret. On that note, a word of caution: Be very careful where you get your information on the real estate market. The reality is most who are providing an opinion (us included), have their income level influenced by the real estate market and therefore have a vested interest in keeping this juggernaut going. When we once again reach all-time highs in Nanaimo for average single-family home sale prices, statistics like this can be used to paint a picture that simply isn’t the reality.

For a consultation specific to your situation, or if you have any questions about market conditions, please contact us at info@jahelkagroup.com and we would be happy to help.

Check out the Nanaimo Market Statistics Here: Market Statistics June 2019

Source: VIREB

June 11, 2019

Nanaimo Market Statistics May 2019

Nanaimo Market Remains Relatively Resilient in May


Single Family Prices and Volume

136 single-family homes sold in May, 32 more than the 104 sold in April, but 3 less than the 139 that were reported as sold in the same timeframe last year. The average home price increased by 1.15% in May to $593,326 from April’s average of $586,595 which is over 5% higher than reported last May when the average home price was $563,218. The median sale price decreased 0.84% to $575,000 in May from April’s $579,900 which is 3.6% higher than the same time frame last year when the median sale price was $555,000. 240 homes were listed in May, which was 30% more than the 184 homes listed in April, and 9.8% less than the 266 listed in May of 2018.

Insights: While volumes are down, so far this year the Nanaimo real estate market has continued to be remarkably resilient when compared to many other Canadian cities. The average sale price ticked up slightly from April and being up 5% year-over-year when many other markets are seeing price declines, is definitely a positive sign for homeowners in our region.

Earlier this year the theme seemed to be that the sub-$600k category continued to be quite competitive, while the higher end of the market (which we had defined as $800k+) in Nanaimo had experienced a noticeable slowdown with active listing numbers starting to climb fairly steadily. Last month we reported April’s numbers and suggested that the $800+ market had started to show some signs of life, and this developing trend followed through in May, with 14 more single-family home sales registered so far above $800,000, including 9 at $1,000,000 or more. Currently, with 128 active listings of homes over $800,000, there is just over 9 months supply based on last months figure of 14 homes absorbed. While this figure is still largely reflective of a buyer’s market, it is nowhere near the implied supply levels we had reported earlier this year, where we were talking years, not months. While this is certainly a positive development, it is important to point out that we often see homes purchased at higher price points by out-of-town buyers who have the financial resources available to do so. With that in mind, it is not a huge surprise that we have seen more higher priced sales the past couple of months as the weather has improved and out-of-town buyers are visiting the island with dual purpose agendas - to enjoy the local recreational opportunities and tourist activities, while also spending some time house hunting. It will be interesting to watch to see if this trend continues heading into summer and early fall. Nonetheless, the expectation at this stage given the macro-market struggles the real estate market is facing, is that higher end sales volume is likely to slow again once the tourist season slows down in the fall, as the local population at large simply doesn’t have the financial resources necessary to absorb the supply of higher-priced homes that are being listed as aging baby boomers / empty nesters bring their homes to the market.

Looking at sales volume, while the number of sales increased from April, that was expected, as historically May volume outpaces April volume as the traditionally vibrant spring market hits its stride. However, so far this year, sales volumes remain depressed from levels experienced earlier in this cycle. This year’s total of 461 single-family home sales for the first 5 months of the year was down 14% from the 536 in 2018, down 26% from the 624 in 2017, down 38% from the cycle high of 749 in 2016, and down 20% from the 577 sales during this period in 2015.

So what is driving the volume slowdown? In our opinion, there are a few factors at work here. The reality is local buyers continued to face affordability constraints and there are just not enough homes at price levels to be absorbed by the market that local buyers can afford. A second contributor to the slowdown is that in higher-priced neighbourhoods, sellers are likely still referencing what their neighbours sold for in 2017 or 2018 and using these figures to anchor their opinion of value, as opposed to recognizing that conditions are shifting and there is more choice for buyers at higher price points with less buyer demand, so pricing competitively is increasingly more important if there is motivation to sell. Thirdly, we are seeing less out-of-town buying for a few reasons. Slowdowns in other markets are resulting in some nervousness from buyers, price declines in other markets while our market has remained relatively resilient is closing the “value gap”, where buyers can no longer to the same extent cash out on their mainland property and buy a much more impressive home in the area and pocket the rest for a rainy day. Further, the foreign buyer and speculation taxes have both served to reduce out-of-town buyer demand. Taken together, it doesn’t appear that volumes will be significantly picking up any time soon.

So how did Nanaimo stack up against other Island communities north of Victoria for the month of May? Looking at the average price, Nanaimo up 5% was eclipsed by Port Alberni/West Coast up 12% and the Cowichan Valley up 7%. The average price in the Comox Valley was also up 5%, while Campbell River was up 1%, and Parksville/Qualicum experienced an average price decline of 3%. Volume wise, only Parksville / Qualicum (up 29%) and Port Alberni / West Coast (up 6%) experienced increases. Nanaimo down 2% was a fairly minor decrease relative to Campbell River (-10%), Comox Valley (-32%), and Cowichan Valley (-36%). Looking at the entire Vancouver Island Real Estate Board totals, the average sale price was up 3% while volume was down 12% from May of 2018.

Strength of the Trend

Factors we also look at when analyzing a market to validate its strength are sell/list ratio; sell price; days to sell, and current inventory numbers:

The sell/list ratio remained at 57% in May, which is up 9.6% from May of 2018 when the ratio was 52%.

For the fourth consecutive month, the sell price/list price came in at 98%, which is down from May 2018 when it was 99%.

The average days on the market decreased by 5 days to 24 in May, which is 50% higher than May of last year when days on market averaged at 16.

As of the end of May, the number of active listings was 381, up 13.4% from April’s 336 active listings, and 6.4% higher than at the same time last year when there were 358 active listings at month end.

Insights: When considering both month-over-month and year-over-year figures, 2 of 8 market indicators in this section improved, 4 deteriorated, and 2 remained constant. These figures and the month-to-month volatility we are seeing here is consistent with a market that continues to transition to more of a balanced overall market from the strong sellers’ market we had experienced for the past number of years. By and large, the numbers we are seeing by historical standards are still quite respectable.

Top Performing Neighbourhoods & Categories

8 of the 18 sub-areas defined by the real estate board in Nanaimo saw an increase in the average selling price (trailing 12 months) from April to May, with 12 of the 18 also experiencing increased prices year-over-year. When looking at these neighbourhood figures, it is important to note that we use trailing 12-month figures to limit volatility caused by lower transaction volumes in some neighbourhoods, where a few high priced or low priced transactions could tremendously skew results. A trailing 12 figure will always be slower to react than simple month-over-month, so that is why the results here are not going to be as pronounced as the figures used in the stats we report above. Moving on, these year-over-year average price changes range from -10.43% in Brechin Hill, the bottom performer for the second month running, to 12.99% in Cedar replacing Pleasant Valley, the chart-topper since August 2018. The top riser month-over-month was Hammond Bay with South Nanaimo the second highest. Top performers year-over-year were Cedar, Pleasant Valley, Hammond Bay, South Nanaimo, and Diver Lake. Looking at volume, 7 of the 18 sub-areas saw increases month-over-month with Hammond Bay and the Old City coming in as the top risers, while only four neighbourhoods, (North Jingle Pot, Lower Lantzville, Upper Lantzville, and Diver Lake), saw increases year-over-year.

Insights: Difficult to draw any significant conclusions here. Some neighbourhoods are up, some are down, with seemingly no particular rhyme or reason. I’d suggest the results here are simply reflective of a market trending more towards balanced conditions.

Single-family waterfront homes, townhouses, single-family homes, and patio homes were the categories that saw an increase in average sale price from April to May, while all categories with the exception of lots experienced increases from May of last year. All categories reported month-over-month increases in sales volume, with only single-family waterfront, townhouses, and lots also experiencing increases year-over-year.

Insights: Waterfront single family homes and townhouses had very strong showings on both an average price and sales volume basis. Time of year always factors into waterfront sales activity, so not a huge surprise that one of the warmest, sunniest Mays on record showed strong in this category. Strength in the townhome market likely has a different driver. Affordability challenges that have priced many single-family buyers out of that market is likely propelling the townhouse market, which is seemingly viewed as the next best alternative to single-family living for those buyers.

Opportunities

From our perspective, we see overall, the market continuing to trend towards more balanced market conditions. However, the key term there is “overall” as, within the overall local market, we see some fragmentation or noticeable variances among price brackets and categories. While we commented earlier that sales volume has picked up a bit at the higher end of the market, the general trend over the past 6 months, when you zoom in on different price ranges for single-family homes, is that there has been some noticeable disparity amongst price ranges. Again, while we don’t like to generalize, you could look at the sub-$600k range as still being very much a seller’s market as long as the home is priced reasonably. The $600k - $800k range is more balanced, but trending towards a buyer’s market at the higher end of the range, with the $800k + range with approximately 9 months of supply based on last months absorptions numbers would be considered in buyer’s market territory.

Sellers take note…the sub-$600k market is still overheated, as affordability constraints of local buyers and a subdued supply of listings in this price range has created a competitive market in this price range. If you are a homeowner or investor thinking about selling your home priced below $600k - $650k, with the lack of suitable options for buyers and still strong demand, you have a great opportunity to sell into strength. While we don’t have a crystal ball, we see that in the coming years if inventory levels remain elevated at higher price points, at some stage motivated sellers are going to adjust their pricing expectations to secure a sale. We’d anticipate that there will be somewhat of a ripple effect, where we are going to see more value at various price points than we are seeing now. While we don’t foresee average prices correcting much, if at all, in the coming year or two, what we do see is that dollars will likely stretch further and buyers will be able to buy nicer homes at more affordable prices than they can today. When you have 2,000 square foot 60s and 70s homes in marginal areas on the verge of needing $50,000 worth of work to replace all the majors (windows, roof, furnace, etc.) listed above $500,000, we don’t see that as sustainable, as Nanaimo household income levels simply won’t be able to support it. The only reason sellers are getting away with this so far this year is that there is limited supply at this price and lots of buyers. When the homes that are not moving at higher prices start to be priced more competitively (if they do) and become competition, these homes will eventually have to be priced more attractively to move. The other important factor is that if prices start to come down and the masses become fearful that prices could be declining, those fearful of a falling may list their homes to limit their downside risk. The result of this is increasing inventory, more choice for buyers and the weaker options at a given price point will need to adjust their pricing to remain competitive. In summary, if you are thinking about selling a home that may need a fair amount of work or that isn’t in the most ideal location, sell into strength - strong buyer demand and limited inventory, don’t wait until inventory levels pick up and buyers have more choice and room to negotiate, as is starting to happen at high price levels.

On that note, where do we see opportunities for buyers? Well, with 129 homes priced above $800k currently on the market, there has to be a few motivated sellers out there getting increasingly anxious and who may be ripe for reasonable price concessions. For buyer’s looking at higher end homes, we’d caution you to take your time as seller sentiment is still optimistic that the current slowdown is still just a hiccup on a further trek upwards in pricing. Unfortunately, there is a decent contingent of industry players who continue to validate this outlook to their clients in this market, and the increase in average sale prices the last couple of months will only seek to support this sentiment. Despite the recent improved market action at the higher end, when you start looking at what has caused the higher end of the market to stall out, our take is that this is going to get worse before it gets better, so some patience from buyers is likely going to be rewarded. So you may be wondering what has caused the higher-end market to stall out? Here is our take… On the demand side, the cooling lower mainland market and intensified media coverage of the slowdown is making lower mainland buyers fearful of buying, and the foreign buyers’ tax and speculation tax has nearly killed demand from foreign buyers. When you look at the origin of buyers of higher priced homes at the peak of this cycle, much of it was mainland and foreign buyers who had the income levels to finance or the cash required to purchase these higher priced properties. When you remove the out-of-town buyers, local buyers simply can’t support the current price levels. Looking at the supply side, contributing to what we feel will be some pain here is the fact that increasingly you have the largest block of our population (aging baby boomers) who are living in these $800,000+ homes and are looking to downsize in the coming years. This will likely only lead to an increase in the supply of homes priced towards the top end of the market, as Nanaimo income levels will not qualify buyers for financing to absorb the increased supply of homes coming on the market. Until we see substantial renewed demand from out-of-town buyers with deep pockets, this should result in even more choice and negotiating strength for buyers at the higher end of the market.

While sellers of higher-end homes may have missed the top of this market cycle, life circumstances will continue to drive sellers to list their homes. With more listings currently on the market and fewer buyers, it is all the more vital that the home is priced accurately and competitively to maximize exposure when interest is the highest. So if you are listing, selecting a Realtor with a strong marketing platform and an active approach to marketing your home is becoming increasingly important. While we went through a period for the last few years where a For Sale sign and an MLS listing were enough to entice buyers to write an offer (definitely not our approach), in this market that haphazard approach is simply not going to cut it.

For investors, on the buy side, patience is going to be rewarded. If you are considering an income property, our take is that currently you are likely best served by looking at other markets or waiting it out as there is no way you are going to cash flow on a leveraged purchase. Given what we have outlined above, we would not recommend speculating on further price appreciation with a negative cash flow property in this market. For multi-family investors, cap rates are at historic lows and therefore valuations at all-time highs. Factoring in the significant number of purpose-built rental apartment buildings currently in the development permitting or building permitting stage, the increased supply of rental units in the coming years is going to potentially put downward pressure on rental rates, and push up vacancy rates which are already starting to increase. While expectations are that further interest rate hikes are likely on hold for the foreseeable future, rates are still below historic norms, so it is likely that at some point over the next few years we will continue the climb to a more normalized interest rate environment. When that happens, eventually cap rates will start to see a similar increase towards more normalized levels. Without the upward pressure on rents, this is setting the stage for decreasing values. We’ve not exactly described the ideal conditions for investment.

Remember, over time real estate generally appreciates. We just know there are peaks and valleys. Buy on the way to the peak and you are positioning yourself for success, buy on the way to the valley, not so much. It is our mandate to provide you with information that you can use to determine which side of the peak we are on, and ultimately to help you make informed decisions that you will not regret. On that note, a word of caution: Be very careful where you get your information on the real estate market. The reality is most who are providing an opinion (us included), have their income level influenced by the real estate market and therefore have a vested interest in keeping this juggernaut going. When we once again reach all-time highs in Nanaimo for average single-family home sale prices, statistics like this can be used to paint a picture that simply isn’t the reality.

For a consultation specific to your situation, or if you have any questions about market conditions, please contact us at info@jahelkagroup.com and we would be happy to help.

Check out the Nanaimo Market Statistics Here: Monthly Statistics May 2019

Source: VIREB

May 6, 2019

Nanaimo Market Statistics April 2019

Average Sale Price Climbs to New High on Reduced Sales Volume 


Single Family Prices and Volume

104 single-family homes sold in April, 9 more than the 95 sold in March, but 18 less than the 122 that were reported as sold in the same timeframe last year. The average home price increased by 7.3% in April to $586,595 from March’s average of $546,656 which is also 6% higher than reported last April when the average home price was $553,352. The median sale price increased almost 9.5% to $579,900 in April from March’s $530,000 which is 9% higher than the same time frame last year when the median sale price was $532,000. 184 homes were listed in April, which was 7% less than the 198 homes listed in March, and 18.6% less than the 226 listed in April of 2018.

Insights: A 7.3% spike month-over-month in the average home sale price catches your attention, even more so given the fairly soft overall market conditions we have experienced so far in 2019 in Nanaimo. If you have been following our commentary, you will know that while we are describing the “overall” market conditions as fairly soft, so far this year the lower end of the market has remained very competitive, while activity at the higher end of the market had basically come to a screeching halt. For the first time this year, the $800,000+ market started to show some signs of life in April, with 11 sales registered so far above $800,000, including 5 at $1,000,000 or more.

Looking at sales volume, while the number of sales increased from March, that was expected, as historically April volume outpaces March volume as we transition into the typically vibrant spring market. Looking at the year-over-year volume comparison, what is more notable, than the fact there were 18 fewer sales than in April of 2018, is that the 104 sales this year is 35 fewer sales than April of 2017, and 84 fewer sales than in April of 2016. Given that we are now in the midst of what is historically the busiest months of the year for real estate transactions, the continued noticeable decline in sales volume is really the leading story. For the first 4 months of 2019 there has now been 325 single family home sales, which represents an 18% decline from the subdued numbers we experienced for the first quarter of 2018, a 27% drop off from 2017, and a 40% decline from the cycle-high of 539 sales in the first 4 months of 2016.

So while most April market reviews are likely highlighting the fact that April’s average sale price was actually the highest average sales price for single-family homes ever achieved in Nanaimo (which it was), we would caution that with subdued sales volume and a more normalized number of homes selling in the $800,000+ range, these higher priced sales are having a more significant effect on pushing up the average sale price than would be the case if volume was more normalized. The reality is local buyers continued to face affordability constraints and there are just not enough homes at price levels to be absorbed by the market that local buyers can afford. In higher-priced neighbourhoods, sellers are likely still referencing what their neighbours sold for in 2017 or 2018 and using these figures to anchor their opinion of value. Until this changes, and it will at some stage if sellers want to sell their homes, sales volumes, especially at higher prices, are poised to stay relatively subdued.

So how did Nanaimo stack up against other Island communities north of Victoria for the month of April? Looking at average price, Nanaimo up 6% was eclipsed by Campbell River, which was the top performer, with the average sale price up 15% year-over-year, the Comox Valley up 9%, Parksville/Qualicum up 8%, and Port Alberni up 7%. Nanaimo’s increase did, however, outpace the Cowichan Valley’s 3%. With the exception of Port Alberni, which saw volume up 15%, all markets saw sales volume decline. Looking at the entire Vancouver Island Real Estate Board totals, the average sale price was up 7% while volume was down 13% from April of 2018.

Strength of the Trend

Factors we also look at when analyzing a market to validate its strength are sell/list ratio; sell price; days to sell, and current inventory numbers:

The sell/list ratio increased from 48% in March to 57% in April, which is also up from April of 2018 when the ratio was 54%.

For the third consecutive month, the sell price/list price came in at 98%, which is down from April 2018 when it was 99%.

The average days on the market decreased by 4 days to 29 in April, which is 53% higher than April of last year when days on market averaged at 19.

As of the end of April, the number of active listings was 336, up 7.7% from March’s 312 active listings, and just over 9% higher than at the same time last year when there were 308 active listings at month end.

Insights: When considering both month-over-month and year-over-year figures, 3 of 8 market indicators in this section improved, 4 deteriorated, and 1 remained constant. These figures and the month-to-month volatility we are seeing here is consistent with a market that continues to transition to more of a balanced overall market from the strong sellers’ market we had experienced for the past number of years. By and large, the numbers we are seeing by historical standards are still all quite respectable.

Top Performing Neighbourhoods & Categories

9 of the 18 sub-areas defined by the real estate board in Nanaimo saw an increase in the average selling price (trailing 12 months) from March to April, with 15 of the 18 also experiencing increased prices year-over-year. When looking at these neighbourhood figures, it is important to note that we use trailing 12-month figures to limit volatility caused by lower transaction volumes in some neighbourhoods, where a few high priced or low priced transactions could tremendously skew results. A trailing 12 figure will always be slower to react than simple month-over-month, so that is why the results here are not going to be as pronounced as the figures used in the stats we report above. Moving on, these year-over-year average price changes range from -10.66% in Brechin Hill to 15.61% in Pleasant Valley, topping the chart since August 2018. The top riser month-over-month was Cedar with South Jingle Pot the second highest. Top performers year-over-year were Pleasant Valley, Cedar, Diver Lake, Old City, Central Nanaimo, and the University District. Looking at volume, 6 of the 18 sub-areas saw increases month-over-month with Lower and Upper Lantzville the top risers, while only three neighbourhoods, (North Jingle Pot, Diver Lake, and Lower Lantzville), saw increases year-over-year.

Insights: We continue to see that the historically more affordable areas continue to experience the greatest year-over-year average home price appreciation, which is fairly typical at this stage in the cycle as many buyers have been priced out of the highest priced neighbourhoods.

Patio homes, single-family homes, apartment-style condos, and lots were the categories that saw an increase in average sale price from March to April, and from April of last year. Townhouses were down month-over-month, but still up 14.62% year-over-year. Single-family homes, patio homes, and townhouses reported month-over-month increases in sales volume, with only lots experiencing increases year-over-year.

Insights: If you have been following our commentary for a while, you will know that we are quite bullish on the market for patio homes given the demographic-driven demand. Over the past couple years we have seen patio homes consistently exhibit both strong price and volume action. After seeing the patio home category come in as the poorest performer in March, the category has rebounded back to the top of the categorical chart in April. As discussed above, single-family homes also had a strong showing, with the higher end of the market finally starting to show some signs of life here in 2019.

Opportunities

Sellers take note…the sub-$600k market is still overheated, as affordability constraints of local buyers and a subdued supply of listings in this price range has created a competitive market in this price range. If you are a homeowner or investor thinking about selling your home priced below $600 - $650k, this spring may represent your best opportunity over the next few years to do so. With inventory levels remaining elevated at higher price points, at some stage motivated sellers are going to adjust their pricing expectations to secure a sale. We’d anticipate that there will be somewhat of a ripple effect, where we are going to see more value at various price points than we are seeing now. While we don’t foresee average prices correcting much, if at all, in the coming year or two, what we do see is that dollars will likely stretch further and buyers will be able to buy nicer homes at more affordable prices than they can today. When you have 2,000 square foot 60s and 70s homes in marginal areas on the verge of needing $50,000 worth of work to replace all the majors (windows, roof, furnace, etc.) listed above $500,000, we don’t see that as sustainable, as Nanaimo household income levels simply won’t be able to support it. The only reason sellers are getting away with this so far this spring is that there is limited supply at this price and lots of buyers. When the homes that are not moving at higher prices start to be priced more competitively and become competition, these homes will eventually have to be priced more attractively to move. The other important factor is that if prices start to come down and the masses become fearful that prices could be declining, those fearful of a falling may list their homes to limit their downside risk. The result of this is increasing inventory, more choice for buyers and the weaker options at a given price point will need to adjust their pricing to remain competitive. In summary, if you are thinking about selling a home that may need a fair amount of work or that isn’t in the most ideal location, sell into strength - strong buyer demand and limited inventory, don’t wait until inventory levels pick up and buyers have more choice and room to negotiate, as is starting to happen at high price levels.

From our perspective, despite the one month spike in average single-family home sale price, overall we see the market increasingly moving towards more balanced market conditions. However, as we mentioned last month, this is the “broad strokes” take on the market. While April sales included a higher percentage at the higher end of the range, over the past 6 months, when you zoom in on different price ranges in the single-family market, there has been some noticeable disparity amongst price ranges. Again, while we don’t like to generalize, you could look at the sub-$600k range as still being very much a seller’s market as long as the home is priced reasonably. The $600k - $800k range is more balanced, but trending towards a buyer’s market at the higher end of the range, with the $800k + range very much a buyer’s market. At the time of writing, there are 129 active listings of homes priced beyond $800,000 in Nanaimo, so even with the elevated sales volume of 11 sales above $800,000 in April, we still have nearly a year’s supply of listings to be absorbed.

On that note, where do we see opportunities for buyers? Well, with increasing inventory levels for homes priced above $800k, there has to be a few motivated sellers out there getting increasingly anxious and who may be ripe for reasonable price concessions. For buyer’s looking at higher end homes, we’d caution you to take your time as seller sentiment is still optimistic that the current slowdown is still just a hiccup on a further trek upwards in pricing. Unfortunately, there is a decent contingent of industry players who continue to validate this outlook to their clients in this market, and the spike in average sale price in April will only seek to support this sentiment. Despite April’s improved market action at the higher end, when you start looking at what has caused the higher end of the market to stall out, our take is that this is going to get worse before it gets better, so some patience from buyers is likely going to be rewarded. So what has caused the higher-end market to stall out? Here is our take… On the demand side, the cooling lower mainland market and intensified media coverage of the slowdown is making lower mainland buyers fearful of buying, and the foreign buyers’ tax and speculation tax has nearly killed demand from foreign buyers. When you look at who was gobbling up the higher priced homes at the peak of this cycle, much of it was mainland and foreign buyers who had the income levels to finance or the cash required to purchase these higher priced properties. When you remove the out-of-town buyers, local buyers simply can’t support the current price levels. Looking at the supply side, contributing to what we feel will be some pain here is the fact that increasingly you have the largest block of our population (aging baby boomers) who are living in these $800,000+ homes and are looking to downsize in the coming years. This will likely only lead to an increase in the supply of homes priced towards the top end of the market, as Nanaimo income levels will not qualify buyers for financing to absorb the increased supply of homes coming on the market. Until we see substantial renewed demand from out-of-town buyers with deep pockets, this should result in even more choice and negotiating strength for buyers at the higher end of the market.

While sellers of higher-end homes may have missed the top of this market cycle, life circumstances will continue to drive sellers to list their homes. With more listings currently on the market and fewer buyers, it is all the more vital that the home is priced accurately and competitively to maximize exposure when interest is the highest. So if you are listing, selecting a Realtor with a strong marketing platform and an active approach to marketing your home is becoming increasingly important. While we went through a period for the last few years where a For Sale sign and an MLS listing were enough to entice buyers to write an offer (definitely not our approach), in this market that haphazard approach is simply not going to cut it.

For investors, on the buy side, patience is going to be rewarded. If you are considering an income property, you are likely best served by looking at other markets or waiting it out as there is no way you are going to cash flow on a leveraged purchase. Given what we have outlined above, we would not recommend speculating on further price appreciation with a negative cash flow property in this market. For multi-family investors, cap rates are at historic lows and therefore valuations at all-time highs. Factoring in the significant number of purpose-built rental apartment buildings currently in the development permitting or building permitting stage, the increased supply of rental units in the coming years is going to potentially put downward pressure on rental rates, and push up vacancy rates which are already starting to increase. While expectations are that further interest rate hikes are likely on hold for the foreseeable future, rates are still below historic norms, so it is likely that before too long we will continue the climb to a more normalized interest rate environment. When that happens, eventually cap rates will start to see a similar increase towards more normalized levels. Without the upward pressure on rents, this is setting the stage for decreasing values. We’ve not exactly described the ideal conditions for investment.

Remember, over time real estate generally appreciates. We just know there are peaks and valleys. Buy on the way to the peak and you are positioning yourself for success, buy on the way to the valley, not so much. It is our mandate to provide you with information that you can use to determine which side of the peak we are on, and ultimately to help you make informed decisions that you will not regret. On that note, a word of caution: Be very careful where you get your information on the real estate market. The reality is most who are providing an opinion (us included), have their income level influenced by the real estate market and therefore have a vested interest in keeping this juggernaut going. When we have one-month average price increases of 7.3%, statistics like this can be used to paint a picture that simply isn’t the reality.

For a consultation specific to your situation, or if you have any questions about market conditions, please contact us at info@jahelkagroup.com and we would be happy to help.

Check out the Nanaimo Market Statistics Here: Monthly Statistics April 2019

Source: VIREB

April 8, 2019

Nanaimo Market Statistics March 2019


Inventory Levels Mounting At The Higher End of The Market


Single Family Prices and Volume

95 single-family homes sold in March, 24 more than the 71 sold in February, but 6 less than the 101 that were reported as sold in the same timeframe last year. The average home price decreased by a fraction in March to $546,656 from February’s average of $546,662, which is 0.86% lower than reported last March when the average home price was $551,392. The median sale price increased almost 3% to $530,000 in March from February’s $515,000 but this is 1.4% lower than the same time frame last year when the median sale price was $537,500. 198 homes were listed in March, which was actually 65% more than the 120 homes listed in February, and 2.6% more than the 193 listed in March of 2018.

Insights: For the second month in a row, the average home price is down when compared to the same month a year ago, albeit marginally. Similarly, sales volume was down slightly and the number of new listings up slightly when compared against March of last year. By and large, this falls in line with our 2019 Forecast, where we predicted prices, volume, and listing volume to remain relatively flat when compared against last year’s numbers, suggesting by the time we turn the page on the calendar year, we may have experienced a slight pick-up in sales volume on the condition that sellers’ expectations on price become more realistic, otherwise we could be looking at a further decline in annual sales volume. Looking at the first quarter of 2019, sales volume totaled 221, which was down noticeably for the third consecutive year (275 in 2018, 307 in 2017), after reaching a cycle high of 351 sales in 2016. The takeaway here is that so far in 2019, many sellers are not pricing their homes where they need to be priced in order to sell. In higher-priced neighbourhoods, sellers are likely still referencing what their neighbours sold for in 2017 or 2018 and using these figures to anchor their opinion of value. Until this changes, and it will at some stage if sellers want to sell their homes, sales volumes, especially at higher prices, are poised to stay relatively subdued.

So how did Nanaimo stack up against other Island communities north of Victoria for the month of March? Nanaimo is actually doing relatively well. Looking at average price, the Comox Valley and Cowichan Valley were up on significantly lower sales volume, while Campbell River was up on slightly elevated volume. Parksville/Qualicum and Port Alberni posted double-digit average price decreases on declining volume. Looking at the entire Vancouver Island Real Estate Board totals, the average sale price was essentially flat, up less than half a percent, while volume was down 23% from March of 2018.

Strength of the Trend

Factors we also look at when analyzing a market to validate its strength are sell/list ratio; sell price; days to sell, and current inventory numbers:

The sell/list ratio decreased from 59% in February to 48% in March, which is also down from March of 2018 when the ratio was 52%.

February’s sell price/list price remained at 98% in March, which is down from March 2018 when the sell price/list price was at 100%.

The average days on the market increased by 1 day to 33 in March, which is 65% higher than March of last year when the average days on the market came in at 20.

As of the end of March, the number of active listings was 312, up 20.5% from February’s 259 active listings, and almost 15% higher than at the same time last year when there were 272 active listings at month end.

Insights: When considering both month-over-month and year-over-year figures, 7 of 8 market indicators in this section deteriorated, with only month-over-month sell price/list price remaining constant at 98%. Nothing improved. While the market is taking a much-needed break after such a strong run over the past few years, the results we are seeing are not suggesting that a market crash or significant correction is imminent, as these numbers by historical standards are still all quite respectable. The deterioration here is more of a reflection of the fact that the strong market action experienced over the last number of years was simply not sustainable.

Top Performing Neighbourhoods & Categories

9 of the 18 sub-areas defined by the real estate board in Nanaimo saw an increase in the average selling price (trailing 12 months) from February to March, with 14 of the 18 also experiencing increased prices year-over-year. When looking at these neighbourhood figures, it is important to note that we use trailing 12-month figures to limit volatility caused by lower transaction volumes in some neighbourhoods, where a few high priced or low priced transactions could tremendously skew results. A trailing 12 figure will always be slower to react than simple month-over-month, so that is why the results here are not going to be as pronounced as the figures used in the stats we report above. This also explains why we reported in the previous section, that year-over-year, the average home price has decreased, and then report in this section that 14 of 18 neighbourhoods are up - it is simply different reporting periods, as the year-over-year figure from a year ago that we are comparing against this year’s trailing-12 figure also incorporates the previous 12 month’s results into the average. Moving on, these year-over-year average price changes range from -4.07% in Lower Lantzville to 13.37% in Pleasant Valley, topping the chart since August 2018. The top riser month-over-month was the University District with Upper Lantzville the second highest. Top performers year-over-year were Pleasant Valley, Diver Lake, Old City, and Cedar. Looking at volume, 7 of the 18 sub-areas saw increases month-over-month with Brechin Hill and Cedar the top risers, while no neighbourhoods experienced increases both monthly and annually.

Insights: As alluded to above, the trailing 12-month figures are not telling the whole story, as these averages are still benefiting from the stronger months that were experienced at certain points throughout 2018. With a bit of a lag here on the trailing 12-month figures, we are starting to see more neighbourhoods’ reporting periods showing month-over-month average price decreases. The areas that are still showing strength are primarily the more affordable neighbourhoods, as a fair contingent of buyers have been priced out of the highest priced neighbourhoods.

On relatively low volume, lots, townhouses, and single-family waterfront homes were the only categories that saw an increase in average sale price from February to March, while only townhomes saw increases year-over-year. All categories with the exception of patio homes experienced month-over-month increases in sales volume, with only single family waterfront and lots experiencing increases year-over-year.

Insights: It is not a huge surprise that townhomes are continuing to perform strongly, given the affordability challenges that are impacting the single-family home market. If you think about it, what do you do when you are priced out of the single-family home market? Sit on the sidelines and hope that prices come down, or alternatively, buy a townhome which offers many of the same benefits (without the maintenance requirements) at a more affordable price point. If you have been following our commentary for a while, you will know that we are quite bullish on the market for patio homes given the demographic-driven demand. Over the past couple of years, we have seen patio homes consistently exhibit both strong price and volume action. Seeing (my beloved) patio home category as the poorest performer in March initially drew an extended double-take. However, when you consider where the demand for ground-oriented retirement residences is coming from, it does actually make some sense. Local downsizing baby-boomers are struggling to sell their 3,000+ square foot homes (more on this to come) as the local population, by and large, cannot carry the debt load required to purchase these homes at the prices sellers are expecting. Out-of-town buyers who are hoping to make Central Vancouver Island their retirement destination of choice are also being constrained by their local market conditions. It is important to remember that while the Nanaimo market is slowing, relative to other communities across the country, Nanaimo is actually fairing better than many other communities. Take the Lower Mainland, where a significant percentage of buyers originated from over the past 4 years, and the sales volume reported by the Greater Vancouver Real Estate Board for March dropped 46.3% below the 10-year average, a decrease of 31.4% from March of last year when volume had already slowed significantly. Prices are also down significantly from their cycle highs, so taken together, if far fewer homes are selling, there are far fewer buyers in a position to make the move to the Island for retirement.

Opportunities

From our perspective, overall we see the market increasingly moving towards more balanced market conditions. However, this is the “broad strokes” take on the market. When you zoom in on different price ranges in the single-family market, there is some noticeable disparity between price range. Again, while we don’t like to generalize, you could look at the sub-$600k range as still being very much a seller’s market as long as the home is priced reasonably. The $600k - $800k range is more balanced, but trending towards a buyer’s market at the higher end of the range, with the $800k + range very much a buyer’s market. At the time of writing, there are 152 active listings of homes priced beyond $800,000 in Nanaimo, yet there were only 4 sales in March above $800,000, which is down from 5 in February, despite overall sales volume being up 34% from February. At the end of February, there were 102 homes on the market priced above $800,000, so in one month inventory levels increased by 50, nearly 50%, and we haven’t even approached the busiest listing months of the year. At this rate of absorption, we are now sitting on more than 3 years' supply, with mounting listing numbers…How quickly things change.

Sellers take note…the sub-$600k market is still overheated, as affordability constraints of local buyers and a subdued supply of listings in this price range has created a competitive market in this price range. If you are a homeowner or investor thinking about selling your home priced below $600 - $650k, this spring likely represents your best opportunity over the next few years to do so. With inventory levels continuing to grow at higher price points, at some stage motivated sellers are going to adjust their pricing expectations to secure a sale. We’d anticipate that there will be somewhat of a ripple effect, where we are going to see more value at various price points than we are seeing now. While we don’t foresee average prices correcting much, if at all, in the coming year or two, what we do see is that dollars will likely stretch further and buyers will be able to buy nicer homes at more affordable prices than they can today. When you have 2,000 square foot 60s and 70s homes in marginal areas on the verge of needing $50,000 worth of work to replace all the majors (windows, roof, furnace, etc.) listed above $500,000, we don’t see that as sustainable, as Nanaimo household income levels simply won’t be able to support it. The only reason sellers are getting away with this so far this spring is that there is limited supply at this price and lots of buyers. When the homes that are not moving at higher prices start to be priced more competitively and become competition, these homes will eventually have to be priced more attractively to move. The other important factor is that if prices start to come down and the masses become fearful that prices could be declining, those fearful of a falling will list their homes to limit their downside risk. The result of this is increasing inventory, more choice for buyers and the weaker options at a given price point will need to adjust their pricing to remain competitive. In summary, if you are thinking about selling a home that may need a fair amount of work or that isn’t in the most ideal location, sell into strength - strong buyer demand and limited inventory, don’t wait until inventory levels pick up and buyers have more choice and room to negotiate, as is starting to happen at high price levels.

On that note, where do we see opportunities for buyers? Well, with increasing inventory levels for homes priced above $800k and sales few and far between, there has to be a few motivated sellers out there getting increasingly anxious and who may be ripe for reasonable price concessions. For buyer’s looking at higher end homes, we’d caution you to take your time as seller sentiment is still optimistic that the current slowdown is still just a hiccup on a further trek upwards in pricing. Unfortunately, there is a decent contingent of industry players who continue to validate this outlook to their clients in this market. When you start looking at what has caused the higher end of the market to stall out, our take is that this is going to get worse before it gets better, so some patience from buyers is likely going to be rewarded. So what has caused the higher-end market to stall out? Here is our take… On the demand side, the cooling lower mainland market and intensified media coverage of the slowdown is making lower mainland buyers fearful of buying, and the foreign buyers’ tax and speculation tax has nearly killed demand from foreign buyers. When you look at who was gobbling up the higher priced homes at the peak of this cycle, much of it was mainland and foreign buyers who had the income levels to finance or the cash required to purchase these higher priced properties. When you remove the out-of-town buyers, local buyers simply can’t support the current price levels. Looking at the supply side, contributing to what we feel will be some pain here is the fact that increasingly you have the largest block of our population (aging baby boomers) who are living in these $800,000+ homes and are looking to downsize in the coming years. This will likely only lead to an increase in the supply of homes priced towards the top end of the market, as Nanaimo income levels will not qualify buyers for financing to absorb the increased supply of homes coming on the market. Until we see substantial renewed demand from out-of-town buyers with deep pockets, this should result in even more choice and negotiating strength for buyers at the higher end of the market.

While sellers of higher-end homes may have missed the top of this market cycle, life circumstances will continue to drive sellers to list their homes. With more listings currently on the market and fewer buyers, it is all the more vital that the home is priced accurately and competitively to maximize exposure when interest is the highest. So if you are listing, selecting a Realtor with a strong marketing platform and an active approach to marketing your home is becoming increasingly important. While we went through a period for the last few years where a For Sale sign and an MLS listing were enough to entice buyers to write an offer (definitely not our approach), in this market that haphazard approach is simply not going to cut it.

For investors, on the buy side, patience is going to be rewarded. If you are considering an income property, you are likely best served by looking at other markets or waiting it out as there is no way you are going to cash flow on a leveraged purchase. Given what we have outlined above, we would not recommend speculating on further price appreciation with a negative cash flow property in this market. For multi-family investors, cap rates are at historic lows and therefore valuations at all-time highs. Factoring in the significant number of purpose-built rental apartment buildings currently in the development permitting or building permitting stage, the increased supply of rental units in the coming years is going to potentially put downward pressure on rental rates, and push up vacancy rates which are already starting to increase. While expectations are that further interest rate hikes are likely on hold for the foreseeable future, rates are still below historic norms, so it is likely that before too long we will continue the climb to a more normalized interest rate environment. When that happens, eventually cap rates will start to see a similar increase towards more normalized levels. Without the upward pressure on rents, this is setting the stage for decreasing values. We’ve not exactly described the ideal conditions for investment.

Remember, over time real estate generally appreciates. We just know there are peaks and valleys. Buy on the way to the peak and you are positioning yourself for success, buy on the way to the valley, not so much. It is our mandate to provide you with information that you can use to determine which side of the peak we are on, and ultimately to help you make informed decisions that you will not regret. On that note, a word of caution: Be very careful where you get your information on the real estate market. The reality is most who are providing an opinion (us included), have their income level influenced by the real estate market and therefore have a vested interest in keeping this juggernaut going. There were sponsored social media ads in our market early in 2019 claiming “the Nanaimo market is just heating up.” Be cautious… watch the headlines…Make sure you get the full story…

For a consultation specific to your situation, or if you have any questions about market conditions, please contact us at info@jahelkagroup.com and we would be happy to help.

Check out the Nanaimo Market Statistics Here: Monthly Statistics March 2019

Source: VIREB

March 4, 2019

Nanaimo Market Statistics February 2019

Average Home Price Is Down Year-over-year for First Time in Years

Single Family Prices and Volume


71 single-family homes sold in February, 16 more than the 55 sold in January, but 14 less than the 85 that sold in the same timeframe last year. The average home price increased marginally by 0.32% in February to $546,662 from January’s average of $544,902, however, this figure is almost 1% lower than last February when the average home price was $551,961. The median sale price decreased almost 4% to $515,000 in February from January’s $535,000 and this is also 5.5% lower than the same time frame last year when the median sale price was $545,000. 120 homes were listed in February, which was actually 20% less than the number of homes listed in January, and just over 14% less than the 140 listed in February of 2018.


Insights: It is no surprise to see sales volume increase from January as the real estate market awakens from its winter slowdown. What is notable is that single-family sales volume for February was the lowest we have seen in Nanaimo for this month in 5 years. Taken together with January’s subdued sales volume, for the first 2 months of the year volume is down 28% over 2018’s figure. While the average price was essentially unchanged from January, what is interesting to note is that for the first time in a number of years, the year-over-year average home price decreased. No longer can the market report month-over-month decreases, and shine a spotlight on the year-over-year figures, stating “while we may be down this month, we are still up X% year-over-year,” claiming that the market is still generally trending upward and the reporting month may be just a temporary blip on a further upward climb. The decline in both month-over-month and year-over-year median home prices is more pronounced, suggesting that more homes sold at lower price points in February. The median figure is important in that it isn’t as affected by a few higher priced sales which can really pull up the average price. Looking at the decrease in listing volume, I’d suggest mother nature had more to do with this than market forces, as significant snowfall and cooler temperatures likely delayed some listings.


Strength of the Trend


Factors we also look at when analyzing a market to validate its strength are sell/list ratio; sell price; days to sell, and current inventory numbers:


The sell/list ratio increased from 37% in January to 59% in February,  although this is down from February of 2018 when the ratio was 74%.


February’s sell price/list price increased to 98% from January’s 96%, however, this figure is down from February 2018 when the sell price/list price was at 100%.


The average days on the market decreased more than 25.5% to 32 in February from 43 in January, but this is still 23% higher than February of last year when the average days on the market came in at 26.


As of the end of February, the number of active listings was 259, down 3% from January’s 268 active listings, however, inventory levels were 23% higher than at the same time last year.


Insights: January was not a great start to the year for the real estate market in Nanaimo. Of the

4 key indicators presented above that we looked at in January (on a month-over-month and year-over-year basis totaling 8 data points), all had deteriorated, some significantly. This month the prognosis is not so grim, as although the year-over-year figures were negative, all of the month-over-month figures improved. What we are seeing here over the past number of months is more of a choppy market, 1 month up, 1 month down type scenario. To me, this suggests that after a number of strong years in the market, we are seeing more of a consolidation pattern, with the market returning to more balanced conditions. While the market is taking a much-needed break after such a strong run, the results we are seeing are not suggesting that a market crash or significant correction is imminent. It is more a reflection of the fact that strong market action experienced over the last number of years was simply not sustainable. There also appears to be more nervousness in the air than we have had for a while in our market. While some of it may be warranted, in the digital world we live in, the media loves to use the shocking stats as “clickbait”, so please take the time to read what is behind the headlines. Given the uncertainty in the market, please stay tuned, as it will be important to closely monitor market conditions as we head into what is traditionally the busier spring months to get a better indication of the true state of the market.


Top Performing Neighbourhoods & Categories


9 of the 18 sub-areas defined by the real estate board in Nanaimo saw an increase in the average selling price (trailing 12 months) from January to February, with 16 of the 18 also experiencing increased prices year-over-year. When looking at these neighbourhood figures, it is important to note that we use trailing 12-month figures to limit volatility caused by lower transaction volumes in some neighbourhoods, where a few high priced or low priced transactions could tremendously skew results. A trailing 12 figure will always be slower to react than simple month-over-month, so that is why the results here are not going to be as pronounced as the figures used in the stats we report above. This also explains why we reported in the previous section, that year-over-year, the average home price has decreased, and then report in this section that 16 of 18 neighbourhoods are up - it is simply different reporting periods, as the year-over-year figure from a year ago that we are comparing against this year’s trailing-12 figure also incorporates the previous 12 month’s results into the average.  Moving on, these year-over-year average price changes range from -4.63% in Upper Lantzville to 16.64% in Pleasant Valley, and while Upper Lantzville has replaced South Jingle Pot in the low spot, Pleasant Valley has topped the chart since August 2018.  The top riser month-over-month was Lower Lantzville with Brechin Hill the second highest. Top performers year-over-year were Pleasant Valley, Diver Lake, Extension, and Central Nanaimo. Looking at volume, 7 of the 18 sub-areas saw increases month-over-month with North Jingle Pot and Cedar the top risers, while North Jingle Pot and Diver Lake were the only neighbourhoods to experience increases both monthly and annually, with North’s Jingle Pot’s results likely stemming from new homes being built and sold in the area.


Insights: As alluded to above, the trailing 12-month figures are not telling the whole story, as these averages are still benefiting from the stronger months that were experienced at certain points throughout 2018. With a bit of a lag here on the trailing 12-month figures, we are starting to see more neighbourhoods reporting periods that show month-over-month average price decreases. The areas that are still showing strength are primarily the more affordable neighbourhoods, as a fair contingent of buyers have been priced out of the highest priced neighbourhoods.


On low volume, lots were the only category that saw a decrease in average sale price from January to February, while only apartments and townhomes saw increases year-over-year. In fact, looking at both month-over-month and year-over-year figures townhomes was the top riser in terms of averages price increases. Single-family homes and townhouses were the only categories to experience month-over-month increases in sales volume, with no categories seeing sales volume increases year-over-year.


Insights: These are affordability challenges on display, with apartment-style condos, townhouses, and patio homes all up month-over-month, and condos and townhomes up year-over-year. What do you do when you are priced out of the single-family home market? Sit on the sidelines and hope that prices come down, or alternatively, buy a townhome which offers many of the same benefits (without the maintenance requirements) at a more affordable price point.  


Opportunities


From our perspective, we see the market increasingly moving towards more balanced market conditions. Pent-up buyer demand has dissipated, either being satisfied by increasing inventory levels, reduced based on government intervention (speculation tax, etc.), stricter lending requirements, higher interest rates, or investors recognizing that the opportunity to acquire cash flowing residential property in the area is now pretty much impossible.


For buyers, what this means is that discerning buyers who were patient through the heights of the market craziness will now have more selection. The continued decline in sales volume further supports this point as more properties are sitting on the market, so sellers needing to sell are going to be getting increasingly anxious and may be ripe for reasonable price concessions. If you are looking at homes above $800,000, you should be in an even better position to negotiate as the higher end of the market has slowed to a near crawl. In February only 5 homes sold above $800,000. When you consider that there are 102 homes currently on the market priced above $800,000, at this rate you have more than 20 month’s supply, and this is before the traditionally busier spring listing season. With that said, we see the $800k+ market likely getting worse before it gets better. On the demand side, the cooling lower mainland market and intensified media coverage of the slowdown is making lower mainland buyers fearful of buying, and the foreign buyers’ tax and speculation tax has nearly killed demand from foreign buyers. When you look at who was gobbling up the higher priced homes at the peak of this cycle, much of it was mainland and foreign buyers who had the income levels to finance or the cash required to purchase these higher priced properties. When you remove the out-of-town buyers, local buyers simply can’t support the current price levels. Looking at the supply side, contributing to what we feel will be some pain here is the fact that increasingly you have the largest block of our population (aging baby boomers) who are living in these $800,000+ homes and are looking to downsize in the coming years. This will likely only lead to an increase in the supply of homes priced towards the top end of the market. So with the expectation of increased supply, and constrained demand resulting in lower sales volumes for higher-priced homes, what happens from here? Either sellers are going to have to adjust their expectations and either price below the competition or be open to significant price concessions in order to sell. Ultimately, the probable outcome is that the gap closes between the price for the average home and homes at the higher end of the market, as demand should remain relatively strong at the lower end of the market as our population continues to increase, and people need somewhere to live. On that note, if you are looking at a more affordable price point (below $600,000) and waiting for prices to drop, in our view it is quite probable that it will never materialize. While the average home price in Nanaimo may decrease in the coming years, it is likely going to be a result of not as many homes selling at the higher end of the market, not homes at more affordable price levels decreasing in value. No matter your scenario, to maximize your potential savings, ensure when selecting a Realtor that they have the proven negotiating skills and market expertise to be able to put together a strong business case to support getting you the very best price in this shifting market.


If you have been following our market updates, you know that in this segment for the better part of the past few years our commentary has become quite repetitive…“ the opportunity is clearly on the sell side”. At this stage, we are fairly confident this ship has sailed unless you are fortunate enough to own a property that will be in high demand for downsizing baby boomers such as ranchers, patio homes, and lifestyle properties at a reasonable price level in close proximity to the ocean, marinas, or golf courses.


While sellers may have missed the top of this market cycle, life circumstances will continue to drive sellers to list their homes. With more listings currently on the market and fewer buyers, it is all the more vital that the home is priced accurately and competitively to maximize exposure when interest is the highest. So if you are listing, selecting a Realtor with a strong marketing platform and an active approach to marketing your home is becoming increasingly important. While we went through a period for the last few years where a For Sale sign and an MLS listing were enough to entice buyers to write an offer (definitely not our approach), in this market that haphazard approach is simply not going to cut it.


For investors, on the buy side, patience is going to be rewarded. If you are considering an income property, you are likely best served by looking at other markets or waiting it out as there is no way you are going to cash flow on a leveraged purchase. Given what we have outlined above, we would not recommend speculating on further price appreciation with a negative cash flow property in this market. For multi-family investors, cap rates are at historic lows and therefore valuations at all-time highs. Factoring in the significant number of purpose-built rental apartment buildings currently in the development permitting or building permitting stage, the increased supply of rental units in the coming years is going to potentially put downward pressure on rental rates, and push up vacancy rates which are already starting to increase. While expectations are that further interest rate hikes are likely on hold for the foreseeable future, rates are still below historic norms, so it is likely that before too long we will continue the climb to a more normalized interest rate environment. When that happens, eventually cap rates will start to see a similar increase towards more normalized levels. Without the upward pressure on rents, this is setting the stage for decreasing values. We’ve not exactly described the ideal conditions for investment.


Remember, over time real estate generally appreciates. We just know there are peaks and valleys. Buy on the way to the peak and you are positioning yourself for success, buy on the way to the valley, not so much. It is our mandate to provide you with information that you can use to determine which side of the peak we are on, and ultimately to help you make informed decisions that you will not regret. On that note, a word of caution: Be very careful where you get your information on the real estate market. The reality is most who are providing an opinion (us included), have their income level influenced by the real estate market and therefore have a vested interest in keeping this juggernaut going. There were sponsored social media ads in our market early in 2019 claiming “the Nanaimo market is just heating up.” Be cautious… watch the headlines...Make sure you get the full story…


For a consultation specific to your situation, or if you have any questions about market conditions, please contact us at info@jahelkagroup.com and we would be happy to help.


Check out the Nanaimo Market Statistics Here:  Monthly Statistics February 2019


Source: VIREB

Feb. 4, 2019

Nanaimo Market Statistics January 2019


January Market Conditions Show Further Signs of Weakness 


Single Family Prices and Volume


55 single-family homes sold in January, 9 more than the 46 sold in December, however more notably 38% less than the 89 that sold in the same timeframe last year. The average home price decreased by just over 5% in January to $544,902 from December’s average of $574,955, which is 4% higher than last January when the average home price was $522,608. The median sale price decreased 6% to $535,000 in January from December’s $569,900 although this is 7% higher than the same time frame last year when the median sale price was $499,900. 150 homes were listed in January representing a substantial increase over the 59 listed in December,  and almost 24% more than the 121 listed in January of 2018. 


Insights: While a month-over-month average sale price decrease of more than 5% may seem alarming, it is important to note that this figure is being determined based on the lowest (December 2018) and second lowest (January 2019) number of single-family sales in a month dating back four years. On low volume, there can be more volatility, and the 5% decrease comes on the heels of an 8% increase in average sale price from November to December of last year, so given the time of year and the low sales volume, I’m not reading into these wild swings as much on their own, but rather looking at other measures as well as evolving patterns to see if there is follow-through signifying a more concrete trend. On that note, what is becoming concerning is the decrease in sales volume. Year-over-year, January sales volume was down 38%, following a 61% decrease in December, and a 34% decrease in November. When sales volume decreases so significantly we look at contributing factors to see if we can identify what is behind the decrease. Naturally, one of the first considerations is the number of new listings and active listings, as we are attempting to determine if there is just a lack of available options for the buyers currently looking to purchase. With the number of new listings 254% higher than December and 24% higher than last December, it certainly wasn’t a lack of new listings keeping sales volume down. Looking at inventory numbers, January’s ending inventory of 269 was 48% higher than we had at the end of January last year and 37% higher than January’s ending inventory in 2017. So what does all this mean? It was not a supply side issue. There is simply not enough serious buyer demand for homes at the prices sellers are asking for their properties. So what does this mean? In order to see sales volume increase, something has to give. Based on the time of year, buyer interest is likely to increase as we head into spring, which is traditionally the busiest time of year for the real estate market. However, as we have highlighted in the past, despite the hopes, dreams, and intentions of buyers, income levels in Nanaimo simply do not support current real estate values when you look at mortgage qualification amounts. In other words, buyer demand at various price points is constrained by the maximum mortgage qualification amount the buyer’s household income would support. With the B-20 stress tests implemented last year, buyers with growing families looking to upsize into a second or third home are simply struggling to qualify to purchase these higher valued homes, and therefore activity at higher price points has slowed to a crawl. In January, there were only 4 sales for homes above $800,000, and the month finished with 99 listings priced above $800,000, equating to a more than 2 year supply. What we are seeing here is the ramifications of the cooling lower mainland market and intensified media coverage of the slowdown making lower mainland buyers fearful of buying, as well as the foreign buyers tax and speculation tax nearly killing demand from foreign buyers. When you look at who was gobbling up the higher priced homes at the peak of this cycle, much of it was mainland and foreign buyers who had the income levels to finance or the cash required to purchase these higher priced properties. Say what you want, when you remove the out-of-town buyers, local buyers simply can’t support the current price levels. So with sales volume so low, what happens from here? Either sellers are going to have to adjust their expectations and price their homes at levels supported by buyer demand or sales volume is likely to remain depressed for the foreseeable future. 


Strength of the Trend


Factors we also look at when analyzing a market to validate its strength are sell/list ratio; sell price; days to sell, and current inventory numbers:


The sell/list ratio decreased by 52.5% to 37% in January,  which is a 50% reduction from January of 2018 when the ratio was 74%. 


January’s sell price/list price decreased to 96% from December’s 97%, which is down just over 3% from January 2018 when the sell price/list price was at 99%.


The average days on the market increased almost 23% to 43 in January from 35 in December, and over 65% from January of last year when the average days on the market came in at 26.


As of the end of January, the number of active listings was 268, up over 4% from December’s 256  active listings, and over 48% higher than inventory levels at the same time last year. 


Insights: We have looked at 4 key indicators here, both on a month-over-month, and year-over-year basis, so taken together there are 8 data points. 8 of 8 have deteriorated, some significantly. The sell/list ratio of 37% is the lowest we have seen dating back to January of 2015 when we started tracking these figures monthly. While this figure is indicative of a buyer’s market, we need more than a single month at this level to say this conclusively. The average sell price/list price of 96% is the lowest we have had since November of 2015, and the average days on market is the highest we have seen since February of 2016. However, more importantly, what you have to look at is the untold story, all the properties sitting stale on the market and not selling. In a scenario where they did sell, you’d have to wonder how far below the asking price they would need to sell, and if they have been sitting for a long time, how these sales would further negatively impact the sell/list price ratio and average days on the market. 


To state the obvious, the market isn’t off to a great start in 2019. While a single month doesn’t tell the whole story, the fall market wasn’t overly strong with noticeable cause for concern. With that being said, it will be important to closely monitor market conditions as we head into what is traditionally the busier spring months to get a better indication of the magnitude of this slowdown. 


Top Performing Neighbourhoods & Categories


12 of the 18 sub-areas defined by the real estate board in Nanaimo saw an increase in the average selling price (trailing 12 months) from December to January, with 15 of the 18 also experiencing increased prices year-over-year. When looking at these neighbourhood figures, it is important to note that we use trailing 12-month figures to limit volatility caused by lower transaction volumes in some neighbourhoods, where a few high priced or low priced transactions could tremendously skew results. A trailing 12 figure will always be slower to react than simple month-over-month, so that is why the results here are not going to be as pronounced as the figures used in the stats we report above. This also explains why we have average prices down month-over-month by more than 5%, yet we are reporting two-thirds of neighbourhoods seeing increasing average sales prices. It is simply different reporting periods. Moving on, these year-over-year average price changes range from -4.49% in South Jingle Pot to 18.48% in Pleasant Valley, with both neighbourhoods holding these same spots since August 2018, although ironically, the top riser month-over-month was South Jingle Pot with Extension the second highest. Top performers year-over-year were Pleasant Valley, Old City, Diver Lake, Central Nanaimo, and Departure Bay. Looking at volume, the only month-over-month risers were Departure Bay and Diver Lake,  with Diver Lake being the only neighbourhood to experience increases both monthly and annually, possibly due to the still relatively affordable homes in the area that are very centrally located in the city.


Insights: The trailing 12-month figures are not telling the whole story, as these averages are still benefiting from the stronger months that were experienced in the first half of 2018. With a bit of a lag here on the trailing 12-month figures, we are starting to see more neighbourhoods each reporting period showing month-over-month average price decreases. The areas that are still showing strength are primarily the more affordable neighbourhoods, as a fair contingent of buyers have been priced out of the highest priced neighbourhoods.


On low volume, lots were the only category that saw an increase in average sale price from December to January, with single-family homes, single-family (waterfront), and apartments seeing increases year-over-year.  Single-family (waterfront) and townhouses were the only categories to experience month-over-month and year-over-year increases in sales volume.


Insights: Really not much to add here. With the lower volume sales, you can’t read too much into a single month’s performance. There were only 4 lot sales and these sales pushed the average up more based on the location of the specific lots than overall market conditions.


Opportunities 


In a best case scenario, we believe the market is moving towards more balanced market conditions. Pent-up buyer demand has dissipated, either being satisfied by increasing inventory levels, reduced based on government intervention (speculation tax, etc.), stricter lending requirements, higher interest rates, or investors recognizing that the opportunity to acquire cash flowing residential property in the area is now pretty much impossible. 


For buyers, what this means is that discerning buyers who were patient through the heights of the market craziness will now have more selection. With the sell to list price dropping to a multi-year low of 96% and inventory levels climbing, there once again may be some room for negotiation. The drop in sales volume further supports this point as more properties are sitting on the market, so sellers needing to sell are going to be getting increasingly anxious and may be ripe for fairly reasonable price concessions. To maximize your potential savings, ensure when selecting a Realtor that they have the proven negotiating skills and market expertise to be able to put together a strong business case to support getting you the very best price in this shifting market. 


If you have been following our market updates, you know that in this segment for many months our commentary has become quite repetitive…“ the opportunity is clearly on the sell side”. At this stage, we are fairly confident this ship has sailed unless you are fortunate enough to own a property that will be in high demand for downsizing baby boomers such ranchers, patio homes, and lifestyle properties in close proximity to the ocean, marinas, or golf courses.


While sellers may have missed the top of this market cycle, life circumstances will continue to drive sellers to list their homes. With more listings currently on the market and fewer buyers, it is all the more vital that the home is priced accurately and competitively to maximize exposure when interest is the highest. So if you are listing, selecting a Realtor with a strong marketing platform and an active approach to marketing your home is becoming increasingly important. While we went through a period for the last few years where a For Sale sign and an MLS listing were enough to entice buyers to write an offer (definitely not our approach), in this market that haphazard approach is simply not going to cut it. 


For investors, on the buy side, patience is going to be rewarded. If you are considering an income property, you are likely best served by looking at other markets or waiting it out as there is no way you are going to cash flow on a leveraged purchase. Given what we have outlined above, we would not recommend speculating on further price appreciation with a negative cash flow property in this market. Just our take… 


Remember, over time real estate generally appreciates. We just know there are peaks and valleys. Buy on the way to the peak and you are positioning yourself for success, buy on the way to the valley, not so much. It is our mandate to provide you with information that you can use to determine which side of the peak we are on, and ultimately to help you make informed decisions that you will not regret. On that note, a word of caution: Be very careful where you get your information on the real estate market. The reality is most who are providing an opinion (us included), have their income level influenced by the real estate market and therefore have a vested interest in keeping this juggernaut going. There are sponsored social media ads in our market right now claiming “the Nanaimo market is just heating up.” Be cautious… watch the headlines...Make sure you get the full story…


For a consultation specific to your situation, or if you have any questions about market conditions, please contact us at info@jahelkagroup.com and we would be happy to help.


Check out the Nanaimo Market Statistics Here:  Monthly Statistics January 2019


Source: VIREB


Jan. 21, 2019

Nanaimo Market Forecast 2019

2019 Forecast


Once again time to pull out the old crystal ball for the 3rd edition of our annual Nanaimo real estate market forecast...Well not exactly…From day 1 the Jahelka Real Estate Group has prioritized delivering value-added content, a true advisory approach in a largely transaction driven business, where we make use of our formal education, training, and experience working with hundreds of buyers and sellers of real estate, to produce information and interpretation of the market to help keep you fully informed as a buyer, seller, investor or observer of the real estate market in the Harbour City. In our technology-driven society, anyone can report statistics, however, it is in the interpretation of these statistics and understanding how they may impact your personal circumstances, goals, and objectives, that defines a true advisory approach to the provision of real estate services. Curious about how we did on our 2018 Forecast? Check out our 2018 Recap where we take a look at some of our results.

For the first time in a number of years, there is some uncertainty surrounding our real estate market in Nanaimo. While market timing is nearly impossible, there are signs and symptoms that do give us reasonable insight into the health of the market. I would equate this to going to a doctor for a check-up. They can’t predict the number of days that you have left, but they can rely on their years of formal education and experience to reasonably accurately determine if you are generally in good health. They will also use their training to identify major risks that could drastically shorten your life expectancy such as the discovery of a tumour or clogged major arteries, before setting out a prescribed set of actions to best deal with the situation. Working with an educated, experienced Realtor is actually quite similar, as they will be able to navigate you through the inevitable ups and downs of the market over time, ensuring you are fully informed and well positioned to minimize your downside risk while being well positioned to benefit when opportunities present themselves. If you are contemplating making a move in the year ahead, in a market where you have nearly 400 realtors to choose from, you have a lot of choice. Heading into uncertain times, more so than in years past, this choice will matter. An interesting nuance with our industry is that by and large, most realtors/brokerages charge a similar rate of commission for their services. This just isn’t the case in most other professional service industries. Imagine a scenario where you could hire the top lawyer in town to represent you in a legal case or you could hire his most junior associate who is on his first day on the job, for the same cost. There wouldn’t even be a question about who you would go with. For many, real estate will be the largest asset they ever hold, so the stakes are high. You deserve to stay informed, and whether you work with us or not, as the market shifts, please align yourself with trusted advisors who will put your interests first at all times, and bring with them the qualifications, proven results, and a solid understanding of the market required to best position you for success.

Real Estate Cycles

While it may come as a surprise to those who have entered the market over recent years, real estate markets do actually go in cycles, it is not all up, all the time. While some of the circumstances impacting these cycles differ from cycle to cycle, the constant is there is always a cycle… Stagnation (economic slowdown), recovery where increased consumer demand starts to eat through the excess inventory from the past market top, credit-fueled expansion where lenders are more freely financing new developments, speculative market top where new entrants to the development game jump in late and overbuild late in the cycle, correction where supply exceeds demand and lenders tighten up lending policies, back into stagnation again ...repeat. While market cycles are a near certainty, what isn’t is the duration of any one cycle. While there are some consistent factors that influence market cycles such as interest rates, lending policies, demographics, employment levels, population change, etc., there are also new influences each cycle which can have an impact. One such factor in the most recent upswing is technology. Social media has forever changed how information is shared, speeding up the rate of information dissemination immensely. Real estate marketing has changed, whereby buyers can now virtually walk through a home online with the click of a mouse, or conduct a short facetime walk-through with their agent, viewing properties from the comfort of their own homes. Writing offers, done online as well through various e-signature platforms. In the information age, real estate markets which historically have been very localized have been opened up, whereby we have out-of-market, and in some cases, out-of-country buyers purchasing real estate sight unseen. What does this all mean? Well, our take is that the speed and ease of transacting in real estate, and the increased spotlight social media and other modern methods of information sharing has placed on the industry is likely to accelerate the speed at which cycles take place, whilst also increasing volatility, as industry players can react much quicker to new information. In a market largely driven by greed and fear, heightened exposure about strong real estate returns and speculators jumping in magnify the impact of the market boom. On the flip side, negative or pessimistic media coverage and social sharing, and fear can very quickly cool a market. When we start to look at next cycle innovations and influences, we see financial technology or “fintech” drastically changing the lending landscape. While we won’t get into details in this report, we see that this will further serve to speed up cycle times and volatility.

Alright, so what does all of this cycle talk have to do with the 2019 Forecast? Well, since real estate cycles have been a constant, it is our belief that looking at the past cycle in our local market could provide some insight into what could be in store moving forward. For those new to the area or too young to remember, here is a brief snapshot of the single-family housing market in Nanaimo dating back to 2006.

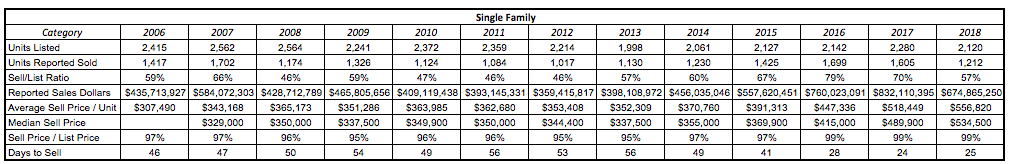
Based on factors such as sales volume, sell/list ratio, and average home price increases, after a number of positive years, we see 2007 as the previous cycle market top. Following this, 2008 had some similarities to a decade later in 2018, which followed what in our view was this cycle’s market top in 2017. In 2008, average home prices were up 6.4%, similar to the 7.4% average increase in 2018. However, both sales volume and sell/list ratio took a fairly major step down in both years. 2018 saw sales volume drop 24.4%, which was the largest year-over-year volume drop since the 31% in 2008. The sell/list ratio dropped from 70% to 57% in 2018. In 2008 it was a decrease to 46% from 66%.

So what happened in 2009? The number of listings dropped nearly 13%, sales volume went up nearly 13%, the sell/list ratio rebounded to 59%, the average sale price was down 3.8%, median price was down 3.6%, the sell price/list price dropped to 95%, and the average days on market increased 8%.

Over the next 4 years, the market experienced a prolonged slowdown. Average home sale prices remained relatively flat, as following the -3.8% result in 2009, there was a 3.62% increase in 2010, followed by decreases of -0.36% and -2.56% in 2011 and 2012, and -0.31% in 2013. During this period sales volume fell well below the 10-year average, bottoming out in 2012 with 1,017 single-family home sales. For those homes that did sell, the sell price/list price ratio was in the 95-96% range, and average days on market was in the 49-56 day range. From 2010 to 2012, the sell/list ratio hovered between 46% and 47%, before the market started to show some signs of renewed life in 2013 with a sell/list ratio of 57% on the heels of a cycle low in units listed (1,998).

2014 signalled the transition into the recovery phase of the cycle which prevailed for the better part of the next 2 years, where we saw sales volume increase, the sell/list ratio hit 60% and 67% respectively, average sales prices increased 5.24% and 5.54%, and the sell price/list price increased to 97%, with both years experiencing significant decreases in average days required to sell. 2016 and 2017 represented the credit-fueled expansion phase of this cycle. Money was cheap (low interest rates) and lending policy was looser, with financing more readily available than it had been during the prolonged slowdown. In both of these years, sales volume was well above the 10 year average, the sell/list ratio was above 70%, home values were soaring with average sale prices rising 14.32% in 2016 and 15.90% in 2017, the sell price/list price was 99% and the average days on market was below 30, reaching the cycle low in 2017 at 24 days. From later 2017 onwards, we see the market reaching this cycle’s speculative top. Those who have sat on the sidelines and watched others reap the rewards of participating in a strong market are now jumping in as investors and “wannabe” developers. Construction costs are skyrocketing, build quality is dropping, and lending policy is tightening. Sophisticated investors and experienced developers are starting to unload their inventory, managing their downside risk to a market correction. With double-digit price appreciation becoming the “new normal”, sellers’ expectations have never been higher and homes are being overpriced, as inexperienced realtors who have only participated in an upmarket validate the unrealistic expectations of sellers by taking overpriced listings, resulting in the first significant decrease (24.4%) in sales volume, back down below the 10-year average with the sell/list ratio dropping.

While we have discussed the market action for single-family homes for illustrative purposes, we also track similar statistics for lots, apartment condos, townhomes, patio homes, etc., and would be more than happy to answer cycle related questions pertaining to any of these real estate categories.

Leaving 2018, this provides the perfect segue into our forecast of what is to come in 2019 and beyond.

Here’s our take on what is to come:

Demand

While there are some key drivers that impact demand, it is important to remember that there are “macro” drivers which seem to impact the broader market, and there are the “micro” drivers which are much more focused and poised to impact certain locations, categories of real estate, or price points more so than others. At different points during the cycle, real estate markets will be driven more by either the macro-market influences where values across all categories or locations tend to move in the same direction or conversely by micro-market influences where real estate market performance is going to see increased variance by category or location. While we expect that there will be some macro influences, we see the 2019 real estate market in Nanaimo being more influenced by micro influences than has been the case over the past number of years, where basically all categories and areas saw values soar across the province, like a rising tide taking everything in its path along for the ride.

Drilling down to focus on the Nanaimo market, we reference the 2017 VIREB Buyer’s Survey, which is the most telling resource available to provide insight into what was driving demand at the peak of the current market cycle. The survey detailed that 64.2% of buyers in 2017 moved from other communities, 56.7% new to Nanaimo, and 7.5% returning after living away. So where did these buyers come from? 27.9% from the Lower Mainland and 12.3% from Victoria, making a reasonable assumption that affordability challenges and the relative value offered in Nanaimo was likely a key consideration for those roughly 40% of buyers making the move from the Lower Mainland or Victoria. A further 19.2% moved from elsewhere on Vancouver Island, 12.3% from other areas in BC, and 19.2% from other areas of Canada. It would be reasonable to assume that affordability and value was not a primary motivator for the move for these 50.7% of buyers from these areas as outside of a few markets (Toronto, Okanagan, etc.), Nanaimo’s average price would have actually been similar or higher than most other markets in Canada. The survey indicated that 4.9% of purchases were made by international buyers, so the international influence was probably not as strong as the underlying belief that foreign buyers were significantly impacting demand in the area. Diving deeper into buyer motivation for purchasing and the survey revealed that 54.6% of buyers were purchasing their retirement residence, whereas only 15.4% of buyers were first time home buyers, where mortgage financing and qualification amounts are significant influences on demand at various price points and for certain categories of real estate.

If you read our 2017 Forecast and 2018 Forecast, we talked a fair bit about pent up demand, that was unmet by subdued inventory levels. It was this pent up demand and lack of supply which was driving the rapid price increases in our market. It is our take that this pent-up demand has largely been satisfied, and that some buyer demand from those looking to move from other markets has dissipated based on changing macro market conditions, where there is no longer an underlying fear of buying now in the area to lock up their retirement residence before prices get out of reach.

While we see more balanced market conditions moving forward, Vancouver Island is increasingly being sought as the retirement destination of choice for Canadians across the country. With about half of the out-of-town buyers coming from areas where affordability was not likely the primary motivator of the move, and 54.6% of buyers purchasing their retirement residence, make no mistake, the demographic behemoth known as the baby boomers are poised to provide sustained demand in the area over the next decade which should serve to insulate our area more so than others from any rapid price decreases or major corrections. Retiring baby boomers are also less likely to require mortgage financing to make their purchases, so with interest rates expected to return to more normalized (higher) levels over the next number of years, the negative impact on buyer purchasing power should not be as pronounced as it would be in other markets where demand is primarily driven by those in their working years and heavily reliant on maximizing mortgage qualification amounts to participate in the market.

As we mentioned in the opening of this section, from a performance perspective, we would expect more differentiation among categories of real estate and price points.

Starting with categories, we see sustained demand over the next decade for low-maintenance, stratified properties catering to local empty nesters entering retirement and those increasingly seeking out Central Vancouver Island as their retirement destination of choice. Ranchers and unique lifestyle properties on golf courses or near marinas, as well as homes that are manageable size-wise in terms of square footage but are complemented by sizeable storage capacity, especially large detached garages (where the baby boomers can store all of their “stuff”), should all see fairly sustainable demand.

Looking at price levels, it is important to consider that demand varies at different price levels and for different asset classes. Starting with price levels, Nanaimo has experienced average single-family home price increases of 14% in 2016, 16% in 2017 and 7% in 2018. When you consider that the most recent census indicated that the median household income in Nanaimo is $62,822, with an average total income of $76,942, and with mortgage qualification becoming increasingly challenging with the stress tests that have been put in place, it is inevitable that at some point you hit a wall where regardless of whether or not buyers would like to purchase at a certain price level, prospective buyers are simply unable to qualify for it. Right now millennials are in their household formation years, which should be driving demand from first-time home buyers. Yet, in 2017, only 15.4% of purchasers were first-time buyers. With Nanaimo still transitioning from a primarily blue-collar economy to more of a serviced-based, retail economy setting up to serve the baby boomers in their retirement years, the job market in Nanaimo simply doesn’t provide the types of jobs and income required to support families buying homes that would adequately meet their space needs. For illustrative purposes, we used RateHub.ca’s Mortgage Affordability Calculator in a scenario where a buyer had a downpayment of $25,000, property taxes were $3,000 per year, and heating costs were $150 per month, with no significant consumer debt, at the Bank of Canada’s current qualifying rate of 5.34% to see what the median and average household incomes in Nanaimo would qualify for.

The calculator indicates that the median household income in Nanaimo would qualify for a mortgage of $287,609, and the average household income would qualify for a mortgage of $349,456. Yes, you read that right. The median household income in Nanaimo would qualify for a mortgage $287,346 less than the average home price in the city… This is assuming the buyer has no other debt, but in the World’s most indebted nation, how many citizens of Nanaimo with a household income of $62,822 have no debt, or the additional $287,609 in cash readily available to use merely to purchase what amounts to an average home? Homeowners who have been in the market a while and who rode this cycle upwards resulting in substantial home equity that they could turn over, maybe; first time home buyers and young families just getting established, no chance. Make no mistake, this will have a significant impact on demand and ultimately housing prices. We see this as the number one headwind the Nanaimo housing market currently faces as the largest block of our population is the baby boomers, many of whom are now empty nesters living in the 3,000+ square foot homes they bought in the $200,000 - $300,000 range a 10 to 15 years ago, that are now valued well beyond the grasp of the average household in town based on income qualification. With that said, we see constrained demand for single detached family homes that wouldn’t typically appeal to retiring baby boomers, especially those priced beyond $600,000, many of which are in the 3,000+ square foot range that empty nesters are trying to unload to enjoy their retirement.

One category that we are bullish on long-term is acreages. Land is still relatively cheap in our area relative to the Lower Mainland, and land is in short supply in close proximity to larger urban centers. With increasing densification in the city and smaller and smaller lot sizes, we see that the next market upswing should see solid demand from those with the financial means and those moving from out of town for 2-5 acre properties. Larger acreage and farm properties within a half hour drive from Central Vancouver Island communities, especially if there is any rezoning potential will likely also be in high demand.

Supply

It should be an interesting year on the supply side of the equation. As noted in our 2018 Recap, there were 7% fewer listings in 2018 than 2017. However, sales volume dropped 24.4% with the sell/list ratio decreasing to 57% from 70% in 2017. What is also important to mention is that with such a notable drop in sales volume, active inventory levels throughout most of the year were higher than they were in the same month in 2017. With an increased number of homes that had listings expired as a result of owners overshooting on their listing price and who were unwilling to price at a level that would have brought buyer interest, it will be interesting to see if sellers disappointed that they may have missed a market top choose to sit on the sidelines, or whether we will see their homes back on the market with more realistic sales prices, which should be well received by buyers constrained by mortgage qualification amounts.

Looking at the downsizing baby boomers, when considering a move their primary driver is likely lifestyle where they are trying to ease the burden of cleaning and maintaining the 5-bedroom, 3,000+ square foot house, in favor of the 1,600 sqft. stratified property that will free up significant time to enjoy retirement. A significant percentage of these potential sellers will be mortgage free, and those that aren’t but who have spent a decade or more in their current homes will have bought at much lower price levels so mortgage payments should be fairly reasonable, meaning that affordability should not be a significant motivator to possibly chase a market down to meet buyer demand constrained by mortgage qualification levels of families needing the space. This would be putting them in a position where they are “selling low” so that they can “buy high” in what we see will be a competitive market for senior-oriented, single story retirement housing options and lifestyle properties by the golf course or marinas. Being so ripe out of a major market upswing, we see that in the foreseeable future, sellers tied to “what they could have sold for in 2017” are likely to remain content where they are. Looking out a couple of years, if price growth remains relatively muted and reality starts to set in, aging baby boomers will likely reach a breaking point where maintaining a large home and yard is no longer in the cards, at which time inventory levels for these larger homes will rise.

Getting late in the cycle, we typically see an oversupply of new construction. While savvy developers carefully monitor market conditions and adjust accordingly to mitigate their risk exposure, those new to the development game or those new to the Nanaimo market may be overexposed. With a number of multi-family projects either under construction or pre-construction, those that have not pre-sold or that are not located in ideal locations may run into trouble as we see an oversupply of new units hit the market in the next couple of years. Without getting into specifics, there are a few projects on the horizon where we feel out-of-town developers may have missed the mark, failing to understand consumer preferences, stigmas that are associated with certain areas, and the reality that real estate is cyclical and so if you haven’t got your project off the ground and out-of-town buying from working-age professionals with incomes to support their price levels has dried up, then you are not going to be able to obtain unsupported, record prices in a market where excessive supply will likely force price decreases to move inventory as lender pressure mounts due to an overall market slowdown. While we hope we are wrong and downtown is rejuvenated largely on the back of the new development that is changing the real estate landscape in the area, we are definitely cautious on our outlook over the next few years for multi-family new construction. Referencing the past cycle, the market for apartment style condos in Nanaimo was hit much harder than the single-family market, and it happened quickly. From 2008 to 2009, the average days on market increased 41% and average sales prices dropped 9%. From 2010 to 2014, average sale prices declined every year, with the sell/list ratio range from 30% to 38%, clearly a buyer’s market. From the peak of the last cycle in 2007 where we had a sell/list ratio of 65%, it took 8 years to eat through the oversupply of condos to return to a similar sell/list ratio and average sales price reminiscent of previous cycle highs. So what happened in 2009 to precipitate this prolonged slowdown? On the heels of the 2008 great recession, developers in Nanaimo threw caution to the wind and initiated construction on 345 condo units, more than double the average number of condo starts over the past decade. So how many condo starts did we have in 2018? 247, a new cycle high, and the most since you guessed it, 2009.

I know, it is different this time. Vancouver has just discovered Nanaimo...on and on the story goes. A word of caution here… I have had more than one conversation with experienced real estate players in this city who have been through multiple cycles who have told me that in each and every cycle we reach a point where “Vancouver has discovered Nanaimo” and ultimately this provides a false sense of security for new developers who think the underlying demand will be there to support their project despite what market conditions are suggesting. While we hope we are wrong about this, please, please take caution and carefully evaluate the risk potential of any new projects that are being undertaken at this stage in the cycle.

Looking at single-family home starts, we saw 255 in 2018, which is actually below the 10-year average and nearly 28% lower than the 354 in 2017 representing a cycle high. Builders of single-family homes appear to be more nimble and appear to have reacted to shifting market conditions. There are currently 64 new homes on the market in Nanaimo, 14 of which are priced under $600,000, 35 between $600,000 - $799,999, 12 between $800,000 - $999,999, and 3 over $1,000,000. With resale listing inventory still relatively light for single-family homes, there doesn’t appear to be any risk of oversupply based on numbers for single-family new construction. However, with elevated construction costs persisting, the question is whether builders will be able to price to be competitive enough with the resale market (not subject to GST, and without additional costs such as landscaping, in some cases appliances, blinds, etc.). If builders have anticipated shifting market conditions and can price competitively and still hit their margins, then they should fair ok. If construction costs have most builders stretching on price, then we will likely see inventory levels start to pile up. Builders considering taking on additional new builds in the coming year should be cautious in monitoring absorption and construction costs this spring, to determine how they should best play this market in the short term. Those building for the high end of the market should be cautious due to affordability challenges that continue to restrict buyer demand.

Interest Rates

Dating back a couple of months, it seemed that 3 rate hikes in 2019 were almost a foregone conclusion. However, with overall economic growth forecasts for 2019 in Canada being adjusted downward as a result of oil production restrictions in Alberta and concern over the housing market-related industries which would be impacted by a significant slowdown, expectations have very quickly adjusted course to the point where there is talk that a rate cut is nearly as likely as a rate hike as the next move made by the Bank of Canada. With subdued growth and concerns about the housing market, we would expect the Bank of Canada to remain cautious, carefully monitoring numbers and adjusting course as necessary. Given the uncertainty, we feel there is a very reasonable case that could be made to support the next interest rate move heading in both directions. Should the housing market slowdown, which has been magnified by increased media coverage and social sharing and which is still impacted by the B-20 mortgage qualifying stress test inhibiting affordability, become more of an extreme correction than anticipated, having more of a drag of Canadian economic performance than expected, we would likely see no movement in rates or a move downward with rates. However, should the mandated restrictions on oilfield production have the intended outcome and assuming the housing market doesn’t have any major negative surprises in store, our take is that we are likely to see the next move by the Bank of Canada be an increase in their overnight lending rate likely in the second or third quarter of this year. Again, sentiment has shifted so quickly so this is a tough call to make. However, without any major surprises, we see rates by year’s end likely 25, but possibly 50 basis points higher if economic growth surprises to the upside, as the Bank of Canada works towards their objective of normalizing rates over the next few years.

With the 5-year bond yield noticeably declining since November, RBC just this week was the first big bank to decrease their 5-year fixed rates. While in the short term other lenders will likely follow suit, should the situation in the oilfield improve and the impact of the housing market slowdown not escalate further leading to improved overall economic growth expectations, we should see 5-year bond yields increase, likely sending 5-year fixed rates higher by at least 25 basis points by year’s end. As mentioned above, we see the Bank of Canada likely increasing overnight lending rates, which will trigger prime rate and ultimately variable rate mortgage increases by years’ end. With that said, we are not expecting any significant movement here this year, as at this stage we are unlikely to see a repeat of 2018 where the Bank of Canada hiked rates 3 times.

Government Intervention

The B-20 mortgage stress tests likely had a more significant impact on cooling the housing market than was initially intended. Provincially, the expanded foreign buyer tax and speculation tax also played a role in quickly cooling overheated real estate markets. Governments should understand the significant role the housing/construction industry plays in the Canadian economy, as the single largest economic driver in 7 of 10 provinces. Governments also have a vested interest in keeping the economy strong as a thriving economy translates into a thriving tax base. With this being the case, we see 2019 as a year governments will likely keep a close eye on the housing market, but are unlikely to make any knee jerk reactions in the short term. This watch-and-see approach is more likely to translate into policy changes in 2020 and could be a hot topic of debate leading up to the federal election this fall.

Other Markets

For buyers coming from out of town, Nanaimo is always being compared to other markets and affordability plays a huge role here. The Greater Vancouver market is really the “straw that stirs the drink” in our provincial housing market. With year-over-year volume (all property types) in December down 44%, and average home prices declining in the 10% range, with some suggesting certain areas and price points could be down as much as 25%, the Vancouver market which led the market upswing is being hit hard and there is reason to believe there is further pain ahead, as affordability has just gotten so far out of reach for most buyers. With our recent boom driven largely by demand from the Lower Mainland and Victoria buyers, who represented more than 40% of buyers in Nanaimo in 2017 at the peak year of this cycle, we see that short term, much of this demand will dissipate. Lower Mainland buyers are waking up to negative reports about the housing market almost daily, and the market overall is in somewhat of a fearful state. Buyers previously priced out of their local markets are seeing declining prices possibly back into their buying range, and multiple offers are no longer frustrating buyers, and enabling sellers to cash out at ridiculous premiums, setting the stage for a move to the island to live mortgage free. With all that said, we see those driven to move to Nanaimo in large part due to affordability which we estimate was 25% to 35% of peak market buyer demand, will be a relative non-factor in the year or two ahead. Translation, 25% to 35% of buyer demand has likely evaporated.


However, demand from out-of-town buyers should remain fairly consistent for those driven by lifestyle design who are looking at a move to the Island for its climate, recreational opportunities, and increasing infrastructure as a retirement destination of choice. Market conditions will not stop the demographic wave that is the baby boomers hitting their peak retirement years. We see Nanaimo and Central Vancouver Island outpacing other areas in terms of inter-provincial and intra-provincial migration, which should serve to support demand, especially for ground-oriented housing options and lifestyle properties on golf courses and near marinas, all of which should be attractive to baby boomers looking to enjoy the island lifestyle in retirement.

Listing Volume

The number of new listings in 2018 was 7% less than we saw in 2017, however, due to a 24.4% decrease in sales volume, the average month’s ending inventory was higher than it was in 2017, providing more choice for buyers. We see single-family listing volumes remaining in a fairly tight range relative to the 2018 numbers, likely in the +/- 10% range. Referencing the past cycle, the largest year-over-year change in listing volume came in 2009, where listing volume was down 12.6%.

Sales Volume

On the heels of a 24.4% decrease in single-family sales volume, dropping below the 10-year average, we see volume possibly rebounding slightly as sellers who were unable to sell possibly becoming more realistic with their pricing, and overall market sentiment and media coverage of our shifting market likely influencing sellers to be more realistic when pricing a property if they are serious about selling. A rebound from 1,212 units this year up towards or slightly above the 10-year average of 1,285 would be the expectation here, contingent on sellers being more realistic this year when pricing their homes. Should sellers continue to dream that they will get “what their neighbour sold for in 2017”, especially in higher-priced neighbourhoods where demand was driven by affordability-motivated out-of-town buyers which has largely dissipated, we could see sales volume decrease.

Patio home volume should remain strong, driven by demand from retirees. Other categories typically see a slowdown as the market starts to cool, so similar or slightly declining volume could be reasonably expected in 2019.

Sales Price

The price growth increase for single-family homes decelerated in 2018 to 7.4% from 15.9% in 2017 on lower volume and a lower sell/list ratio. With expectations of lower affordability driven demand from out-of-town buyers, more realistic seller pricing leading to a slight increase in sales volume, we see the sell price/list price ratio likely declining from 99%, as sellers will likely need to be more willing to negotiate to secure a sale than in years past. Should all of this occur, we see average prices being relatively flat this year, most likely in the +/- 2.5% range. Should a more drastic correction take hold provincially or nationally, we could see average prices decline year-over-year for the first time since 2013.


Homes priced above $750,000 are more vulnerable to falling values as affordability related constraints will continue to limit demand for homes priced in this range.

Upward pressure on pricing will likely remain for homes in high demand from downsizing baby boomers locally and those choosing to retire here from other areas of the country. Ranchers, patio homes, etc., should see fairly strong price action.

Final Notes

Predicting the future direction of the market with so many variables in play is challenging. This forecast is just our take, please take caution in relying on any information provided here and consult with your real estate professional on current market conditions and expectations before taking action. If you have any questions about market conditions, would like more details specific to your neighbourhood, or for a consultation specific to your situation, please feel free to contact us anytime as we would welcome the opportunity to help.

All the best for 2019!


250.751.0804 | info@jahelkagroup.com | www.jahelkagroup.com

Sources / Referenced / Reviewed:

BCREA Mortgage Forecast

BCREA Housing Forecast

Central 1 Economic Analysis of British Columbia December 2018

CMHC Housing Information Portal, Nanaimo (CY) - Historical Starts by Intended Market

Ratehub.ca Mortgage Affordability Calculator

RBC Economic Research Home Resale and Price Forecast

RBC Economic Outlook December 2018

RBC Economics Research Housing Trends and Affordability

Royal LePage Market Survey Forecast

Saretzky Real Estate Month In Review December 2018

VIREB Buyer Profile

VIREB (various reports)