
Market Conditions Stabilize in June
Single Family Prices and Volume
184 single family homes sold in June, up nearly 10% from the 204 sold in the same timeframe last year, but up 3% from the 178 that sold the previous month. Aside from a slight dip in April, volume has been increasing steadily from the beginning of the year. After a monster month-over-month average price increase from April to May of almost 6%, June’s average essentially flatlined, up a nominal $311 from May, but still an impressive 13% year over year. June’s median price of $500,000 was up more than 4% from May and nearly 14% from last June’s levels. With median prices again climbing, this suggests that home prices at the lower end of the pricing spectrum are on the rise, as competition for affordable properties continues to put upward pressure on pricing. For more on this, please check out our “Only Found Here” section of the report.
Strength of the Trend
Factors we also look at when analyzing a market to validate its strength are sell/list ratio; sell price; days to sell, and current inventory numbers:
The sell/list ratio held tight at 70% in June, down nearly 16% from the 83% posted in June of 2016.
For the homes that did sell, the sell price/list price remained at 100%, the same number achieved in both May 2017 and June 2016. June’s figure is not suggesting every home is selling at 100% of the asking price as it is just an average, with some selling well below asking, and the most attractively priced offerings going into multiple offer situations and selling well above the list price in many cases. For a general frame of reference, typically anything 96-97% and above reflects strong market conditions.
The average number of days on the market increased to 19 after bottoming out at 16 last month. Despite the increase, this figure is still down nearly 14% from last June.
As of the end of June, the number of active listings is 322, up 8% from May, and also an increase of nearly 5% from inventory levels last year. There were 261 new listings in June, which was up nearly 7% from last year’s figure of 245 for June.
While the figures in this section remain strong by historical standards, it should be noted that each month-over-month metric was either flat or inferior. While this is not completely unexpected as the busy spring market transition into summer holidays, it does raise some eyebrows. While one month’s results do not signal a reversal in market conditions, it will be important to monitor these figures in the months to follow. This market has experienced a rapid ascension over the past 30 months with average home prices in Nanaimo up 43%. These substantial month-over-month increases that we have been experiencing are not sustainable long term. Keeping a close eye on the market over the coming months will help determine whether this month’s conditions are just a seasonal cooling or the start of a larger trend.
Only Found Here
This month we took a look at various price points and property categories, examining both days on market and the sell/list ratio in an effort to determine if there were certain categories or price points that were significantly more competitive than others, or on the flip side, whether there were potentially some types of properties or price points where demand may not be as strong, thus exposing potential buying opportunities.
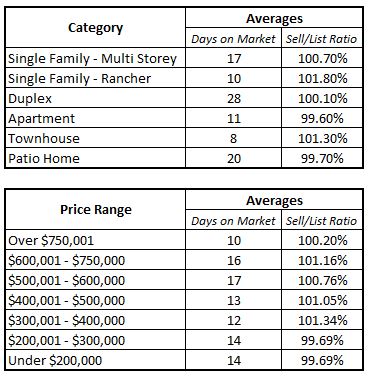
These numbers were taken from raw data provided by VIREB. Please note the highest and lowest days on market figures were removed from each category to reduce the impact of outliers in skewing the results.
In reviewing the findings, probably the biggest surprise was that there weren’t really any categories or price classifications that significantly outperformed or underperformed the other categories. While there was some variance between categories, with only examining a month’s worth of data, the results are by no means conclusive.
Categorically, townhomes, apartments, and ranchers moved a bit quicker than the other categories, not surprising with the downsizing and in-migration trends. The sell/list ratio fell within a band of 2.2% for all categories, again, remarkable consistency.
Examining price categories, somewhat surprising was that the over $750,000 category had the lowest days on market for June. Not surprisingly, the $300,000 - $500,000 was also at the lower end of the spectrum, albeit just a few days less than the other categories. Again here, the Sell/List ratio fell within a 1.65% band. All things considered, with the noted consistencies, it appears at each price point the demand and supply are relatively in balance. In other words, while there are more buyers in the 300,000 - $500,000 range, there are also more listings to satisfy greater demand.
Based strictly on this information, it appears market conditions are currently fairly consistent across real estate categories and price ranges.
Top Performing Neighbourhoods & Categories
13 of the 18 sub-areas defined by the real estate board in Nanaimo saw an increase in the average selling price (trailing 12 months) from May to June, with 16 of 18 experiencing increased prices year-over-year. These annual increases range from 0.08% to 23.53%. Top risers month-over-month were Extension, Lower Lantzville, South Jingle Pot, Departure Bay, and South Nanaimo. Top performers year-over-year were Hammond Bay, Lower Lantzville, Extension, South Nanaimo, and Chase River. Looking at volume, risers both monthly and annually included Uplands, South Nanaimo, Extension, Central Nanaimo, and Pleasant Valley. One notable observation is that volume increases have been most prominent in historically lower priced neighbourhoods, likely as a result of buyers being priced out of more historically in-demand neighbourhoods. This is textbook market action for a maturing real estate market, as many buyers have now been priced out of the traditionally more in-demand neighbourhoods and are forced to expand their search to find a home in their price range. While buyers may be quick to justify their purchases, these neighbourhoods have been the last to rise for a reason and will often be hardest hit when an inevitable correction occurs. This makes it vital for buyers to be working with an experienced realtor who will be able to steer you clear of areas to avoid. While the headlines paint a fairly rosy picture, year-over-year price movements when broken down by neighbourhood range from -5.59% to a high of 23.53%. With real estate market action being location sensitive, it is vital to know what is going on in your area when determining whether the timing may be right to sell your home.
On rising volume, townhouses were the runaway leader in both average month-over-month and year-over-year increases. Patio homes and waterfront homes also fared well. Not surprising given demographics, the surge of mainland buyers moving here to retire, and the mass downsize we are poised to experience as baby boomers trade in their McMansions for a simpler lifestyle and a more enjoyable retirement.
Here is an excerpt from our 2017 Forecast posted as we entered 2017: Current market conditions present an excellent opportunity for those looking to downsize in the coming years to lock-in their recent gains and secure an ideal retirement home before masses go into competition and bid up prices on patio homes and ranchers in the next decade.
Market action so far in 2017 has supported this prediction.
Opportunities
We remain undoubtedly in the midst of a SELLER’s market. We see the opportunities firmly on the sell side. If you have previously listed a property that didn’t result in a sale, now may be the perfect opportunity to re-enter the market. Prices have risen dramatically of late so there is a strong chance that you would be able to list for more than you had previously and arrive at a sale in a timely fashion.
On the buy side, finding a “diamond in the rough” or scoring a “good deal” has been nearly impossible in 2017 with so many buyers actively watching the market. We’ve noticed as we head into summer holidays with the great weather of late that we have been able to secure accepted offers for buyers on a few properties that seem like exceptional value. Basically what has happened in a few cases is realtors are pricing below market value in hopes of drawing in multiple offers with the intention of having buyers become emotionally attached to a property and then bidding it up well in excess of the market value. So when all the buyer are at the beach and no offers come in, sellers get nervous, and properties can transact below market value. Make sure you are working with a realtor who is on the ball to catch these rare opportunities, you have to act quick.
For a consultation specific to your situation, or if you have any questions about market conditions, please contact us at info@jahelkagroup.com and we would be happy to help.
Check out the Nanaimo Market Statistics Here: Monthly Statistics Nanaimo June 2017
Source: VIREB