
Average Home Price Flat Month-over-Month, Up 24% Year-over-Year
Single Family Prices and Volume
152 single family homes sold in July, up 3.4% from the 147 sold in the same timeframe last year, but down 17% from the 184 that sold in June. Given the time of year when people are out enjoying the summer, the slowdown is not unexpected. To provide some context, last July experienced a 27% decline from June in the number of homes sold. For the second month in a row, the average price came in very close to the previous month’s number at $524,435, down 0.4% from June. Again referencing last July’s numbers, the 27% volume drop was accompanied by an average price decrease of more than 9%. Year-over-year, the average home price in Nanaimo was up 24%...yes 24%, it wasn’t a typo, it was an incredible 12 months. July’s median price of $485,000 was a 3% pullback from June’s median price of $500,000, but still up 26% from last July. Again, wow...
Strength of the Trend
Factors we also look at when analyzing a market to validate its strength are sell/list ratio; sell price; days to sell, and current inventory numbers:
The sell/list ratio dipped slightly to 68% from 70% in June and was down nearly 6% from the 72% posted in July of 2016.
For the homes that did sell, for the first time since February, the sell price/list price notched down to 99% from 100%. 99% was consistent with last July’s sell price/list price. July’s figure is not suggesting every home is selling at 99% of the asking price as it is just an average, with some selling well below asking, and the most attractively priced offerings going into multiple offer situations and selling well above the list price in many cases. For a general frame of reference, typically anything 96-97% and above reflects strong market conditions.
The average number of days on the market increased by 1 day to 20. This figure is nearly 18% higher than that of last July, suggesting homes on average took a few days longer to sell than they did last summer.
As of the end of July, the number of active listings is 336, up 4% from June, and 3% from inventory levels last year. There were 224 new listings in July, which was down 14% from June, but up nearly 10% from the number of homes that hit the market last July.
While the figures in this section remain strong by historical standards, it should be noted that for the second straight month, the month-over-month metric was either flat or inferior. While this is not completely unexpected given we are in the middle of summer and have had such a run of great weather making it more attractive to be at the beach than touring properties, it does undoubtedly put our team on alert to be watching for behavioural signs from our clients that buyer sentiment may be changing. Keeping a close eye on the market over the coming months will help determine whether this month’s conditions are just a seasonal cooling or the start of a larger trend.
Only Found Here
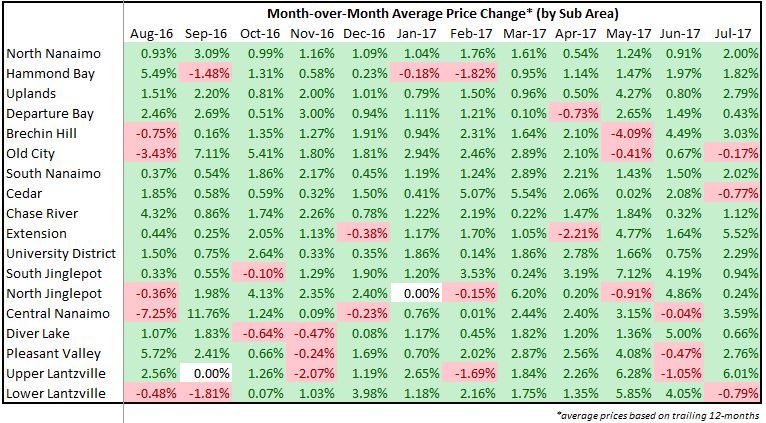
This month take a look at the various neighbourhoods in Nanaimo, more specifically the 18 sub-areas as defined by the real estate board and examine the month-over-month and year-over-year price changes for single family homes that have occurred.
These screenshots provide some insight into some of the proprietary tools our team relies on to stay on top of market conditions. The infographic is quite easy to interpret, basically if the average price went up over the previous period, the cell is green if the average price declined it is red.

Top Performing Neighbourhoods & Categories
15 of the 18 sub-areas defined by the real estate board in Nanaimo saw an increase in the average selling price (trailing 12 months) from June to July, with all 18 experiencing increased prices year-over-year. These annual increases range from 11.88% in Hammond Bay to 27.57% in Pleasant Valley. Top risers month-over-month were Upper Lantzville, Extension, Central Nanaimo, Brechin Hill, and Uplands. Top performers year-over-year were Pleasant Valley, South Jingle Pot, Old City, North Jinglepot, and Uplands. More so than in previous months, the top performers seem somewhat scattered, with no strong correlation among top performing areas. Looking at volume, risers both monthly and annually included Hammond Bay, Old City, Cedar, Chase River, and Extension. One notable observation with the inclusion of Cedar, Chase River, and Extension is that activity remains strong in the South end of the city, likely as a result of buyers being priced out of more historically in-demand neighbourhoods. This is textbook market action for a maturing real estate market, as many buyers have now been priced out of the traditionally more in-demand neighbourhoods and are forced to expand their search to find a home in their price range. What is important to keep in mind is that in some cases these neighbourhoods have been the last to rise for a reason and will often be hardest hit when an inevitable correction occurs. This makes it vital for buyers to be working with an experienced realtor who will be able to steer you clear of areas to avoid.
On low volume, waterfront homes were the runaway leader in both average month-over-month and year-over-year increases as buyers are captivated by the oceanfront lifestyle that is so attractive this time of year. Townhouses, patio homes, and lots were all up year over year and month over month, with patio homes experiencing a noticeable spike in volume. If you’ve been following our commentary, you will not be surprised about this knowing that downsizing baby boomers are poised to drive demand for patio homes for years to come.
Opportunities
We remain undoubtedly in the midst of a SELLER’s market. We see the opportunities firmly on the sell side. If you have previously listed a property that didn’t result in a sale, now may be the perfect opportunity to re-enter the market.
One opportunity we see for Developers would be the creation of low maintenance, more luxurious patio homes or townhouse projects to satisfy the needs of downsizers and retirees moving to the area from other regions. So far this year we have been consistently speaking with potential sellers in the 50 -70 age range who are hesitant to sell because there are so few attractive options to move into. It is interesting in our market to note that for the past 20 or 30 years bigger has meant better. Townhomes were for lower income buyers and patio homes were the preceding step before the senior’s care facility. That is no longer the case. Empty nesters are spending too much money on utilities to heat homes for 2, and spending too much time cleaning and maintaining the yard to fully enjoy their well-deserved retirement. Time is valuable to baby boomers who are seeking meaningful experiences and the freedom to travel. They have the financial resources to afford higher end stratified properties, but these options are extremely limited.
For buyers, continuing on from a trend we started to notice last month, competition has dissipated on the buy side, and homes don’t seem to be snatched up as quickly. Realtors under price properties quite frequently and for much of the spring, the market would have made up the difference, with buyers bringing offers well above the asking price. So here we are in July with buyers out enjoying the summer and the multiple offer situations are not occurring as frequently. There are more chances for buyers to make an offer and have it accepted at a decent price (relative to the market) without having to go into competition. Make sure you are working with a realtor who is on the ball to catch these rare opportunities, you’ll have to act quick.
For a consultation specific to your situation, or if you have any questions about market conditions, please contact us at info@jahelkagroup.com and we would be happy to help.
Check out the Nanaimo Market Statistics Here: Monthly Statistics Nanaimo July 2017
Source: VIREB