March 3, 2017

Investor Insights

Are you a Real Estate Investor or a Real Estate Speculator?

The Nanaimo real estate market has been on a steady, and in some neighbourhoods, a rapid upward ascent for at least 2 years now. With home prices soaring, vacancy rates have dropped below 2% and many landlords are reporting never having received so many applicants for their rental units. Consequently, landlords have been able to increase rents to levels never before experienced in the city. With rents and home prices soaring, what better time to become a real estate investor...After all, how can you lose? Everybody is making money in real estate these days...Have you seen the most recent property assessments? Just buy a few properties, wait a few years and you’ll be retired, sipping Pina Coladas on a tropical beach, all financially supported by your real estate riches...

OK...and...back to reality.

Let’s take a quick look at what has happened over the past few years in Nanaimo... Following the great recession in 2008, Nanaimo’s real estate market experienced a prolonged slowdown. Demand was subdued, prices were flat or down (depending on the type of property and neighbourhood) and vacancy rates on rentals soared from 1.1% at the height of the last cycle’s boom to 8.3% as recently as the spring of 2013. When the market started to show some signs of life in late 2014, the most desirable neighbourhoods (North Nanaimo, Hammond Bay, Departure Bay, etc.) began to move and prices escalated. Fast forward to late 2016 and most buyers had been priced out of the most desirable neighbourhoods and are having to look closer and closer to the city limits, if not beyond, to find a suitable property. The rental market has followed a similar pattern, rents have soared in the most desirable areas driven by demand and vacancy rates have fallen. Then, like a wave emanating from the epicentre of an earthquake, those unsuccessful in finding or unable to afford a home in the most desirable areas are looking closer and closer to the city limits where, just like housing prices at this stage in the market cycle, rents are on the rise.

So fast forward to early 2017, the elusive “mainland buyer” priced out of their local market jumps on the computer and discovers...wow, you can buy a 5 bed/2 bath home on a quarter acre in Nanaimo for around $400k, vacancy rates are sub 2%, and the market is actually up close to 20% year-over-year… Investigating further, it is discovered that Nanaimo’s market has really only been on the rise for a couple years and conventional wisdom suggests the real estate market cycle usually lasts about 7 years. Wow… this market looks like it has a lot more room to run...if the market continues at this pace, that $400,000 home would be up $80k in a year on appreciation alone...With 20% down, that’s essentially a 100% return in 1 year, not even taking into consideration mortgage pay down or cash flow… At this point, said buyer is probably thinking “how can I go wrong?”

Let’s pause....If this is the way you are looking at the market, you are a SPECULATOR. You are gambling 100% on your future expectations. You haven’t considered cash flow potential, where interest rates are likely headed (impacting your future mortgage payments), the potential major renovations a house in this price range may require to even keep it rentable, how vacancy rates can quickly spike in the area when the economy inevitably takes a downturn, the type of tenants the area attracts and the amount of turnover you will likely see, etc. These are just a few vital considerations a speculator would have no regard for. Speculators often try to time the market, using momentum to make fast gains. If they time it right, Woohoo!!! If not, well you probably know how that goes...

On the other hand, an INVESTOR would follow a disciplined process of analyzing any local market before strongly considering an investment. This may involve looking at population growth, housing supply, cyclical trends in regards to rents and vacancy rates, key economic drivers, affordability relative to average incomes, etc. The investor would likely drill down and examine specific neighbourhoods and the amenities that would make them attractive to potential renters such as proximity to jobs, schools, parks, transportation routes, shopping, recreational facilities, etc.  But, first and foremost, what differentiates an investor is that they would be primarily concerned with the numbers. Not what could occur in a best case, almost dream-like scenario (as outlined above), but what could reasonably be expected to occur, based on the macro and micro analysis discussed above, and based on what is happening currently with regards to the financials. Most importantly, does the property cash flow? Not does it cover the mortgage payment...Does it cover all costs associated with the property (mortgage + property tax, insurance, any utilities included, etc.), have you built in a vacancy allowance, is there a buffer for property management and repairs and maintenance? Whether you self-manage or not currently, your situation can often change in the future so we always recommend to our investor clients that they account for property management in their analysis.

Looking at our $400,000 home, purchased with a 20% down payment at 2.69% over a 25-year amortization and you have a monthly mortgage payment of $1464. Factor in property taxes of approx. $200 per month, home insurance of $150, city user rates (garbage,sewer, water) of $75, and you have expenses already at $1889. With projected rents in the $1800-$1900 range, you are already possibly in a negative cash flow situation. Factor in property management ($190 - 10% of rents), allowance for repairs/maintenance ($95 - 5% of rents) and a vacancy allowance ($63 - 3% or rents), and you are now potentially in a negative cash flow position by $437 per month. Upon further investigation, the investor would likely discover this home was probably worth about $250,000 2-3 years ago, the neighbourhood attracts a transient rental pool, vacancy rates typically soar in the area as soon as the economy enters a slow down...the list goes on.

In this scenario, clearly the investor walks, with the speculator likely to jump in anticipating quick profit. While there is no conclusive right or wrong approach to take, after all, the market could rise another 20% in the coming year resulting in a great flip opportunity the investor would have missed, there are measures you can take to mitigate your risk when investing in real estate. Our view is that real estate investing is a long-term wealth building strategy, not a get rich quick scheme. As such, it is every bit as important to protect your downside, as it is to look for opportunities to realize extraordinary gains. Your real estate investments should be viewed in a similar manner to your traditional paper assets (stocks, bonds, mutual funds, etc.) assembled by first having a qualified professional assist with creating a financial plan intended to achieve your financial goals using tools that fit your risk profile and investment objectives.

Make no mistake, if you are investing in real estate, to maximize your results you need a plan. Buying smart, realizing consistent returns over the long-term, and intelligently leveraging equity to expand your portfolio should guarantee you achieve your long-term financial goals through real estate.

If you are considering an investment in real estate or if you need some assistance developing a plan of action, put our team to work for you. Contact us anytime for your complimentary consultation at 250-751-0804 or info@jahelkagroup.com.

March 2, 2017

Nanaimo Monthly Market Recap: February 2017

Strong Market Continues, Particularly for more Affordable Options 

Single Family Prices and Volume

97 single family homes sold in February, down 13% from the 111 sold in the same time frame last year, but not surprisingly up 73% from the 56 that sold the previous month given the traditional slowdown January often experiences coming out of the holiday season. The average sale price for a single family dipped slightly to $495,997, down from $512,063 in January. However, this figure still represents a nearly 20% increase over February of last year. It should be noted that the average price isn’t the only determining factor in assessing the strength of a market. The median sell price is relied upon as a secondary measure which will not be skewed by a few high priced homes selling at the top end of the market. February’s median price dipped 9% to $465,000 from January’s levels, which when taken together with the lower average price suggests more properties moved at the lower end of the market on a percentage basis than what transpired in January. Again, not surprising with young families commonly staying on the sidelines in January as kids head back to school after the holiday break.

Strength of the Trend

Factors we also look at when analyzing a market to validate its strength are sell/list ratio; sell price; days to sell, and current inventory numbers:

The sell/list ratio was down marginally (2%) from 56% to 54% in January, and down 25% from February of 2016. While somewhat surprising, this could be a possible leading indicator of sellers who are starting to become somewhat unrealistic, dare I say greedy, with their listing prices. With a lack of listings, it could also be reflective of Realtors attempting to “buy” listings by overshooting on their recommended list prices to secure a listing, before recommending reducing the price when the listing fails to attract an offer. Sellers, be very careful not to overshoot on your listing price…You have one chance to make a first impression, and you don’t want buyers to rule you out due to being overpriced, as they are likely not coming back for a second look should you decide to price drop.

For the homes that did sell, the sell price/list price ticked up 1 point from 98% to 99%, and was significantly higher than the 95% experienced in February of 2016. February’s figure is not suggesting every home is selling at 99% of the asking price as it is just an average, with some selling well below asking, and the most attractively priced offerings going into multiple offer situations and selling well above the list price in many cases. For a general frame of reference, typically anything 96% and above reflects strong market conditions.

The average number of days on the market decreased 33% to 27, down from 40 in January. It was also a 41% decrease from the average of 46 days in February 2016, suggesting that attractive offerings continue to sell quicker than seen over the past number of years during the winter months and explaining why buyers still need to act quickly to avoid missing choice opportunities.

As of the end of February, the number of active listings is 240, up 22% from the 196 listed in November, but down 17% from the 288 listed at the end of February last year. The increase from January follows the typical rise in listing numbers heading into the spring months, however with depressed year-over-year figures, it is no surprise that buyers continue to struggle to find suitable properties.

Only Found Here

***New for 2017: In this section we provide some insight into a sample of our team’s proprietary analysis data analysis, as well as sharing how we make use of this information to formulate effective strategies for our buyers and sellers.

Days on Market:

  • Selling in 0 - 7 days:
    • Single Family: 64% at an average of 100.83% of the list price.
    • Condo/Strata: 49% at an average of 102.64% of the list price.
  • Selling in 8 -31 days:
    • Single Family: 21% at an average of 98.87% of the list price.
    • Condo/Strata: 34% at an average of 99.89% of the list price.
  • Selling in more than 31 days:
    • Single Family: 15% at an average of 96.46% of the list price.
    • Condo/Strata: 17% at an average of 95.98% of the list price.

Sell Price/List Price:

  • Sold above list price:
    • Single Family: 36% of homes sold above the asking price - at an average of 4.2% above ask. The highest premium paid was 20%, which was an outlier as the next highest was 8%. The average days on market for those selling above the asking price was 11.93, although this was skewed by 1 that required 166 days to sell.
    • Condo/Strata: 35% of condos sold above the asking price at an average of 4.7% above ask. The highest premium paid was 11%, and the average days on market for those selling above the asking price was 5.58.
  • Sold at the list price:
    • Single Family: 19% of homes sold at the ask price in an average of 25.57 days.
    • Condo/Strata: 24% of condos sold at an average of 38 days on the market, skewed upwards by one property on the market for 270 days.
  • Sold between 95% and the list price:
    • Single Family: 39% of homes sold, taking an average of 20.7 days.
    • Condo/Strata: 26% of condos sold, taking an average of 19.1 days.
  • Sold below 95% of the list price:
    • Single Family: 7% of homes sold, taking an average of 88.8 days.
    • Condo/Strata: 15% of condos sold, taking an average of 66.5 days.

There are clearly some key takeaways here:

  1. Demand for condo/strata properties appears to have caught up and in some cases, surpassed the competitiveness for single family homes. This is a marked change from 2016 when condo demand and price action still lagged single family home market conditions.
  2. Homes and condos priced accurately are selling very quickly, in many cases at above the asking price.
  3. If a home has not been priced accurately and has not sold within a week, the market appears to be moving on with the average days on the market jumping drastically.
  4. There is a strong correlation (or inverse relationship if you would like to get technical) between days on market and sell/list price. In general, the lower the days on the market, the higher the price relative to list price. Homes selling well below the asking price (that were overpriced by greedy sellers with unrealistic expectations) are sitting on the market for a significant amount of time as the sellers’ expectations normalize over time.

What this means for Buyers: If you are a serious buyer, you need to be pre-approved and very clear on what you are looking for so that you can offer immediately on the best new options hitting the market.

What this means for Sellers: You need to price accurately to maximize interest. This is not the “leave a little room for negotiation” market. Pricing accurately will minimize the days on market (and inconvenience to your family), as well as best position you for a competitive bidding situation as evidenced by 36% of single family home and 35% of condo/strata sales in February transacting above the asking price. Working with a Realtor with a very strong marketing platform is vital, as is working with an experienced negotiator who can guide you through a potential multiple offer situation.

Top Performing Neighbourhoods & Categories

15 of the 18 sub-areas defined by the real estate board in Nanaimo saw an increase in the average selling price (trailing 12 months) from January to February, with all 18 experiencing increased prices year-over-year.  These annual increases range from 1.25% to 25.80%. Top risers month-over-month were Cedar, South Jingle Pot, Chase River, and Pleasant Valley, most of which are traditionally neighbourhoods at the lower end of the pricing spectrum. Top performers year-over-year were Departure Bay, Chase River, Lower Lantzville, and North Nanaimo. Looking at volume, risers both monthly and annually included Uplands, South Nanaimo, Cedar, Extension, and Lower Lantzville. There are two key observations here…Firstly, most price and volume risers are the traditionally more affordable neighbourhoods. Secondly, most of these neighbourhoods are near the city limits or in the cases of Cedar and Lower Lantzville, technically beyond. This is textbook market action for a maturing real estate market, as many buyers have now been priced out of the traditionally more desirable and/or more conveniently located neighbourhoods in relation to jobs and amenities, and must head further and further out to find a home in their price range.  With real estate being location specific, it is vital to know what is going on in your area when determining whether the timing may be right to sell your home. For buyers, neighbourhoods will experience differing price action throughout the cycle. Again, it pays to know what is happening in each sub-area, to determine whether a purchase would be prudent.

Apartment style condos were undoubtedly the top performing category in February, up 11% month-over-over month and 29% year-over-year on increasing volume.  If you have been following our commentary, this should not come as a surprise as we suggested last spring that while single family home prices were taking off, condos were essentially late to the party, and still well below the peak levels of the last cycle.  Waterfront homes which are in extremely short supply are also seeing significant price increases.

Opportunities

Current market conditions present an excellent opportunity for those looking to downsize in the coming years to lock-in their recent gains and secure an ideal retirement home before masses go into competition and bid up prices on patio homes and ranchers in the next decade.

Now is also a smart time for investors to take some money off the table in anticipation of a market correction in years to come or alternatively to move into other markets that appear to have more immediate upside potential. Without a substantial down payment, finding cash flowing residential properties is nearly impossible. It is our view that purchasing a negative cashflow property has only one certainty...You will lose money...While we don’t know how long this will be the case as rents generally do rise over time, buying a home and speculating that prices will rise in the coming years is a flawed strategy when you could buy in other markets or asset classes (e.g. commercial) and guarantee positive cash flow.

For buyers, as noted above we see opportunity for downsizers to potentially secure their retirement residence at decent price levels. Yes prices are up for all asset classes, but you are better to sell high on the higher priced property, and buy high on the lower priced property than sell lower, and buy lower down the road. For example if you sell a larger home for $600,000 and buy a townhome for $300,000, you have an additional $300,000 to fund your retirement. If the market corrects 10% across the board, you now sell for $540,000, buy for $270,000 and have only $270,000 remaining to fund your retirement. It is also important to note that given the demographics, the buy lower option may never come.

We are by no means suggesting that now is the time to sell for everyone, as individual circumstances differ, as do investment objectives, etc. Remember, we all need a place to live and over time real estate generally appreciates. We just know there are peaks and valleys and we have every reason to believe we are closer to the peak than the valley.

For a consultation specific to your situation, or if you have any questions about market conditions, please contact us at info@jahelkagroup.com and we would be happy to help.

Check out the Nanaimo Market Statistics Here: Monthly Statistics Nanaimo February 2017

Source: VIREB

Feb. 3, 2017

Nanaimo Monthly Market Recap: January 2017


Average Price in Nanaimo Rises Above $500k.  

The Market is on Fire!


Single Family Prices and Volume

56 single family homes sold in January, down 11% from the 63 sold in the same time frame last year, and 21% from the 71 homes that sold last month. The average sale price for a single family home jumped significantly, and for the first time in Nanaimo finished north of the half-million dollar mark at $512,063 up nearly 33% from the January 2016 average of $385,993. That said, the movement in the average price isn’t the only determining factor in assessing the strength of a market. The median sell price is relied upon as a secondary measure which will not be skewed by a few high priced homes selling at the top end of the market. January’s Median price actually eclipsed the average, coming in at $516,000, which represented a 47% year-over-year, and 24% month-over-month increase. These numbers are remarkable, and clearly reflective of the current market strength and pent up buyer demand. The fact that the median price outpaced the average price is also extremely rare, a strong indicator that there are a significant number of homes selling at the higher end of the pricing spectrum. 

Strength of the Trend

Factors we also look at when analyzing a market to validate its strength are sell/list ratio; sell price; days to sell, and current inventory numbers:

The sell/list ratio was down 21% to 56% in January, but up 12% from January of last year. 

The sell price/list price remained strong at 98%, down slightly from 99% in December. However, this figure was up from 97% a year earlier. Generally anything 96% and above reflects strong market conditions. 

The average number of days on the market increased from 28 to 40 month-over-month, however it was down from 49 days in January 2016, representing an 18% decline year-over-year, suggesting that attractive offerings continue to sell quicker than seen over the past number of years during the winter months and explaining why buyers still need to act quickly to avoid missing choice opportunities. One important point on the days on the market is that January typically sees a spike in days on the market as market participants (buyers & sellers) typically pause over the holiday season, before new listings resume and buyers get back out in force a few weeks into January. With that said, the 40 days on market is likely not reflective of how quickly prime listings are selling, as most are snapped up within days, many in multiple-offer situations resulting in prices at or above the listing price. 

As of the end of January, the number of active listings is 196, up slightly from 190 in December, but down significantly from 275 in January 2016. With subdued inventory levels, it is no surprise that buyers continue to struggle to find suitable properties. 

Only Found Here

***New for 2017: In this section we provide some insight into a sample of our team’s proprietary analysis data analysis, as well as sharing how we make use of this information to formulate effective strategies for our buyers and sellers. 

You’ve heard the headlines: Average prices have reached historic highs, inventory levels are at historic lows and many homes are selling at or above the asking price, often in multiple offer situations which is forcing buyers to act very quickly to avoid missing out. With some notable details lacking in the reported statistics, this inevitably leads buyers to wonder if this is all just media and/or Realtor driven hype, after all the average days on market in January was 40, and the average sell price/list price ratio was only 98%. These statistics don’t really support you having to act instantly and often pay thousands of dollars above the asking price to secure an accepted offer. For your viewing pleasure, here are the facts for single family homes sold in January:

Days on Market: 

Homes selling in 0 - 7 days: 56% at an average of 101.2% of the list price

Homes selling in 8 – 31 days: 14% at an average of 99.5% of the list price

Homes taking at least 32 days to sell: 30% at an average of 97.3% of the list price, on the market for an average of 68.5 days.

Sell Price/List Price: 

Sold above list price: 35% of homes sold above the asking price at an average of 3.44% above the asking price. The highest premium paid was 8%, and the average days on market for those selling above the asking price was 4, which would have been lower if not for the fact that many sellers are now holding off on offers for a few days in order to ideally drive a bidding war. 

Sold at list price: 21% of homes sold at the asking price with the average days on market for this category at 14.

Sold below list price: 44% of homes sold below the asking price at an average of 97.13% of the list price, and on the market for an average of 44 days.


There are clearly some key take-aways here: 

1. Homes priced accurately are selling very quickly, in many cases at above the asking price.

2. If a home has not been priced accurately and has not sold within a week, the market appears to be moving on with the average days on the market jumping drastically.

3. There is a strong correlation (or inverse relationship if you would like to get technical) between days on market and sell/list price. In general, the lower the days on the market, the higher the price relative to list price. Homes selling well below the asking price (that were overpriced by greedy sellers with unrealistic expectations) are sitting on the market for a significant amount of time as the sellers’ expectations normalize over time. 

What this means for Buyers: If you are a serious buyer, you need to be pre-approved and very clear on what you are looking for so that you can offer immediately on the best new options hitting the market.  

What this means for sellers: You need to price accurately to maximize interest. This is not the “leave a little room for negotiation” market. Pricing accurately will minimize the days on market (and inconvenience to your family), as well as best position you for a competitive bidding situation which in 35% of January sales resulted in sale price above the asking price. Working with a Realtor with a very strong marketing platform is vital, as is working with an experienced negotiator who can guide you through a potential multiple offer situation.  

Top Performing Neighbourhoods & Categories

16 of the 18 sub-areas defined by the real estate board in Nanaimo saw an increase in the average selling price (trailing 12 months) from December to January, with all 18 experiencing increased prices year-over-year.  These annual increases range from 6.88% to 25.35%. Top risers month-over-month were the Old City, University District, and Upper Lantzville. Top performers year-over-year were Departure Bay, North Jingle Pot, Chase River, North Nanaimo, and South Nanaimo. Of note, South Nanaimo has experienced a significant volume spike in both monthly and annual contexts. Despite the headlines, not all neighbourhoods are moving in the same direction all the time. With real estate being location specific, it is vital to know what is going on in your area when determining whether the timing may be right to sell your home. For buyers, neighbourhoods will experience differing price action throughout the cycle. Again, it pays to know what is happening in each sub-area, to determine whether a purchase would be prudent.

Townhouses were undoubtedly the top performing category in January, up 38% month-over-over month and up more than 32% year-over-year.  Yes, 38% is correct… If you have been following our commentary, this should not come as a surprise as it continues to highlight the impending mass-downsize the baby boomers are poised to drive over the coming years. Lots and single family homes were other categories that had strong showings in January.  

Opportunities 

With upward pressure on pricing remaining strong, driven by solid demand and limited supply, we view purchases in the Nanaimo residential market for investment purposes at this point in the market cycle as speculative. Without a very low-ratio mortgage, finding cash flowing residential investment properties are nearly impossible. In other words, if you are buying a rental property in Nanaimo in January 2017, the only guarantee you have is that you are going to lose money every month, basically crossing your fingers that the market is going to continue upwards. While the short term demand-driven outlook looks promising, there is really no underlying long-term economic support for it to do so. Our primary concern here is average household incomes in Nanaimo don’t support the average housing prices as buyers simply won’t qualify if prices get much higher. Factor in recent government intervention in lending limiting what buyers are qualifying for and there are some major questions about the viability of a continued run up in prices. This is not to say we don’t have another 6 months, 1 year, even 2 years left in the current run. Timing is what is most challenging to predict. The outcome is not…

The reality is the markets will peak, and they will turn downwards. Real estate markets are cyclical, and this move is inevitable, it’s just a matter of when. What we always tell investor clients who are thinking of selling is to pick a number and stick to it, because if the market turns and you get caught, there is a good chance you will ride it down, in hopes of one day getting back to the number that you happily would have sold at in the first place. If this section sounds like a near repeat of a few of our market recaps in late 2016 it’s because it is. We want to hammer this point home...Despite what the average Realtor will tell you (an individual who is also feeding their family based on real estate commission cheques), we are not at the start of a 7-year cycle...

So if it is not abundantly clear by this point in this section, we see opportunities on the sell side, leveraging low inventory numbers and rising prices to maximize recent gains. If you are downsizing, lock in a great return on your primary residence and find your retirement home before the crowd. If you are an investor looking to exit the Nanaimo market in the coming years, while it may be tempting to try to maximize your portfolio growth by timing the top, the better approach is often a more defensive strategy, whereby you look to lock in reasonable gains and protect your downside risk exposure. We are by no means suggesting that now is the time to sell for everyone, as individual circumstances differ, as do investment objectives, etc. What we are saying is that if you are risk averse, and seeing an investment property value down $50,000 - $100,000 from its current value would cause you to lose sleep at night, the spring market may present you with a good opportunity to get out with a very respectable return. For a consultation specific to your situation, please feel free to contact us anytime.

If you have any questions about market conditions or would like more details specific to your neighbourhood, please contact us at info@jahelkagroup.com and we would be happy to help.


Check out the Nanaimo Market Statistics Here.

Source: VIREB


Feb. 1, 2017

Investor Insights


Generating Wealth Through Real Estate:  

The 3 Fool Proof Sources of Return


Nanaimo is in the midst of one of the strongest real estate booms it has ever experienced. Recent property assessments are giving home owners the false sense of financial security that only comes when the market is showing signs of nearing a peak. Buyers are throwing caution to the wind and submitting subject free offers in multiple offer situations on negative cash flow properties under the false premise that you can’t lose in real estate and we are possibly just entering into the second year of the famous “7-year cycle”.

Here’s a dose of reality

You CAN lose in real estate and we are NOT in the early stages of a second year cycle.

While we believe that real estate is the #1 investment category to use to generate wealth, it is important to note that in order to be successful, you must have a plan, process, and screening methods to ensure you are making an investment that is going to positively impact your financial situation. Although there are many ways to make money in real estate and many accompanying risks, much of the risk associated with a real estate investment can be substantially reduced by focusing on the 3 fool proof sources of return. Taken together, these 3 sources are a powerful combination that can create substantial wealth over the long term for the prudent investor.


Let’s take a closer look at these 3 sources:

1.    Mortgage Pay-Down: Simply put, your tenants are paying your mortgage, so after 25 years (or whatever your amortization term is), you will own the property outright. By investing in markets with attractive vacancy rates over time driven by a strong local economy and continuously rising population, you are best positioning yourself to keep your rental property occupied. Over time property values generally rise, so the home is likely to be worth far more than it is today, serving as an inflation hedge. The other interesting point to note is that the CRA will actually allow you to deduct the interest you pay on the mortgage of an investment property as an expense against any income generated on the property, reducing your tax burden.


2.    Appreciation: Over time, real estate values go up. Yes, real estate is cyclical so values do fall from time-to-time, but they recover, and then go higher. Think I’m being overly optimistic? Well, if you can find a time in the last 75 years where values were not higher than they were 10 years previous in this market, I’d love to hear about it, because it hasn’t happened. Although we do not have a crystal ball, we can be reasonably certain that the best indication of what is to come, is to look at what has happened time and time again, through the various real estate cycles of the past century.  According to the Canadian Real Estate Association, in 1984 the average price for a home (all home types) in Canada was $76,351. Fast forward 8 years to 1992 and the number had increased to $149,864.  After a relatively subdued run in the 1990s, the average price hit $164,373, before continuing its aggressive upward ascent in the 2000s to $304,663 in 2008. After recovering from the prolonged post-2008 slump, in 2016 the average price hit $442, 264. If you’d had bought that house in 1984 on a 25-year amortization, by 2009 your tenants would have paid off your mortgage on an asset now worth nearly half a million dollars (and rising) which is kicking out cash flows of thousands of dollars a year.

3.    Positive Cash Flow: True positive cash flow occurs when you have a return left over after all expenses have been paid and allowances have been made. Mortgage payment, insurance, property tax, utilities (if you cover) and allowance for property management, vacancy, and repairs and maintenance must be included here to qualify as a true positive cash flow property.

My #1 rule for a profitable real estate investment

Only invest in true cash flow properties. There are too many out there to forego this important point. After all, with out positive cash flow, the only thing you are guaranteeing when you purchase the property is that you will have an outgoing expense to cover. If you are currently looking for a cash flowing single-family residential investment property in Nanaimo, I know, I know…they don’t exist. So don’t invest in a single-family residential property in Nanaimo. Look at another market, another asset class (multi-family, commercial, etc), sit on your hands, I don’t care, just don’t pay thousands of dollars to guarantee yourself that you will lose money each month!!! PLEASE!


If your property is cash flowing from day 1, you can ensure that you will benefit from appreciation when you sell because your property will be more than paying for itself which will give you flexibility to better time the market to maximize your return. Over time, as long as you have a tenant you will benefit from your mortgage being paid down over time with each payment contributing more towards paying down the principal. And finally, inflation generally results in increasing rents over time. As long as mortgage rates don’t move upwards substantially, rising rents should only serve to increase your cash flow and overall return over time.

Moral of the story

Only invest in a property if it ticks all 3 boxes (or all signs point to the fact it will). Sacrificing cash flow and betting on appreciation is a flawed strategy, as is investing in boom and bust economies with strong cash flow currently, but potential vacancy issues and value decreases down the road (think Alberta oil boomtowns)… Generating wealth through real estate should be viewed as a long-term proposition. By focusing on these 3 points alone, you will be off to a great start.

Jan. 13, 2017

Nanaimo 2016 Market Recap & Look Ahead for 2017


Single Family Prices and Volume

1699 single family homes were sold in 2016, up 19% from the 1425 sold in 2015. The average sale price for a single family home increased 14% to 447,336 from 391,313 a year earlier. The median sell price is relied upon as a secondary measure which will not be skewed by a few high priced homes selling at the top end of the market and 2016's median price was $415,000, up 12% from $369,900 in 2015.

Strength of the Trend

Factors we also look at when analyzing a market to validate its strength are sell/list ratio; sell price; days to sell, and current inventory numbers:

The sell/list ratio increased year-over-year to 79% from 67%, suggesting a higher percentage of homes listed are successfully finding a buyer. On the flip side, this figure still suggests that 21% of homes listed are not selling which in a market with such strong demand and low inventory, suggests some buyers are not being realistic with their pricing expectations or this figure would be higher.

The sell price/list price increased to 99% from 97%. This doesn't mean that all homes are going to sell for 99% of the list price, as those selling significantly above the asking price in multiple offer situations are offsetting those sitting on the market for long periods and selling below 99% of asking. What this suggests is that for buyers it is not deal hunting season. We are in a sellers market, and if as a buyer you are finding that everything "is overpriced", it's not. This is the current state of the market. Limited supply and lots of buyers means any attractive options are going to sell very close to, at or above asking. In the past it may have been normal to offer 5-10% below asking to leave some room for negotiating. Not in this market, you likely won't even get a response.

The average number of days on the market decreased 32% in 2016 to 28 days, down from 41 in 2015. This figure may be a bit misleading as the most attractive options throughout 2016 were consistently selling in less than a week. Where we see higher days on market is when homes are listed beyond their fair market value and have either waited months for the market to come to them or have ultimately had to price drop to secure a sale. With limited inventory and decreasing days on the market, buyers are having to react quickly, and therefore being pre-approved for financing prior to making an offer is all the more vital.

The number of active listings as the calendar turned over was 190, down 24% from December of 2015. What is interesting to note is that 2016 actually saw 17 more single family homes hit the market than in 2015. With all this talk about historically low inventory numbers, it is important to point out that the lower inventory numbers was more attributed to a higher percentage of homes being sold, than the number of listings being down.

Top Performing Neighbourhoods & Categories

In 2016, all 18 sub-areas defined by the real estate board in Nanaimo experienced a price increase, however the weight of the increase varied significantly depending on the sub area from 1% on the low end in Upper Lantzville to 23% on the high end in North Jingle Pot. Despite the headlines, not all neighbourhoods are moving in the same direction all the time. With real estate being location specific, it is vital to know what is going on in your area when determining whether the timing may be right to sell your home. For buyers, neighbourhoods will experience differing price action throughout the cycle. Again, it pays to know what is happening in each sub-area, to determine whether a purchase would be prudent.

There are 6 sub-areas that experienced average price increases of at least 20% - Chase River, Departure Bay, Hammond Bay, North Jingle Pot, North Nanaimo, and South Nanaimo.

However, price alone does not tell the story of a market as volume also has to be taken into consideration. Of the 18 sub-areas in Nanaimo, 14 experienced volume increases, with Brechin Hill, Extension, and South Nanaimo all experiencing volume spikes of at least 50%.

Waterfront homes were the top category in terms of average price increased for 2016, up 19%. Following this, lots came in second at 16%, followed by single family (14%), patio homes (12%), townhomes (8%) and lastly apartment-style condos (7%).

Forecast

Once again time to pull out the old crystal ball...Well not exactly...Here at the Jahelka Real Estate Group we have assembled what is likely the most formally educated, and arguably qualified team in our region to be able to interpret this market and make some sense of where it is going. While market timing is nearly impossible, there are signs and symptoms that do give us reasonable insight into the health of the market. I would equate this to going to a doctor for a check-up. They can't predict the number of days that you have left, but they can rely on their years of formal education to reasonably accurately determine if you are generally in good health. They will also use their training to identify major risks that could drastically shorten your life expectancy such as the discovery of a tumour or clogged major arteries, before setting out a prescribed set of actions to best deal with the situation. Working with an educated, experienced realtor is actually quite similar. You can choose to work with those qualified to competently guide you through the various real estate cycles you will encounter over the course of your life, or you can work with the guy you enjoy having a beer with who they just pulled off the scrap heap at the used car lot who will tell you "I don't know where the market is going, I don't have a crystal ball", "We are at the start of a 7 year cycle" or "You should buy now to avoid missing out", "I don't see this ever slowing down as Nanaimo has just been discovered." While we make light of it, these are all responses we have heard from licensed Realtors in the last 12 months, which has us concerned to say the least. Again, your choice...Realtors are being paid like Doctors in many cases, shouldn't they require some level of qualification or understanding of the market to earn your business?

Here's our take on what is to come:

Demand: Demand is strong with significant pent up demand from those who have been unable to secure a home due to low inventory. In the last 48 hours, our group has been involved in two multiple offer situations with offers thousands above the asking price. We see demand remaining strong through at least the spring market, and likely for at least the first half of this year.

When assessing demand and looking out longer term, it is important to consider that demand varies at different price levels. Although due for an update, the most recent census indicates an average household income in Nanaimo of $67,413. If this household carried $0 debt, they would qualify at best for a mortgage of $400,000. With the average single family home price already at $451,465 as of December 2016, you have to start to question how much more room to run there is at higher price points? Where is the demand going to come from? The largest block of our population is the baby boomers, many of whom are now empty nesters living in the 3,000+ square foot homes they bought in the $200,000 - $300,000 range a decade ago, that are now valued well beyond the grasp of the average household in Nanaimo based on income qualification. It is these boomers who will be looking to downsize in the coming years. However, selling requires buyers, buyers require financing, buyers will likely not be qualified to finance the amount of homes coming onto the market at higher price points. You know where this is going...

Supply: It's difficult to predict with certainty how the market will react to rising prices. While rising property assessments have many homeowners briefly considering "cashing-out", the reality is selling your primary residence requires finding somewhere to go. Given the demographics with many baby-boomers becoming empty nesters, it is likely we will see some looking to downsize in the coming years giving serious consideration to making a move this spring to capitalize on heightened values. We see inventory levels staying fairly consistent with 2016 numbers, with the potential for a marginal increase as greed keeps many sellers who should be considering listing on the sidelines in hopes of the market continuing to creep higher.

Looking out longer term, the coming years will likely see a significant supply of homes 3,000+ square feet hitting the market as empty nesters downsize to reduce expenses and housekeeping requirements to enjoy retirement. Increased supply without increasing demand at these price points puts downward pressure on pricing. Conversely, the supply of ground oriented patio homes, condos, and low maintenance detached single story homes is likely to be insufficient to meet the needs of the downsizers. As such, the gap is likely to close, with a premium being paid for housing options well suited for seniors, while larger family and executive homes while likely become more affordable relative to incomes in the coming years. 

Interest Rates: Given macroeconomic conditions across the country, we see the prime lending rate being held constant for the balance of 2017.

Government Intervention: Here's the wild card. With the BC Liberals jockeying for position, they have already introduced the interest free loan for first time homebuyers. On the other side of the spectrum, the feds are considering further action to try to contain the inherent risks in our country's rising real estate market. Rumours abound on potential intervention with a minimum 10% downpayment apparently on the table for discussions. As we saw in Vancouver with the 15% foreign buyer tax, government intervention can have a significant immediate impact on real estate markets. Although trying to predict what is to come here would be foolish, given the political climate and market conditions, we just want to caution that market conditions can change very quickly as a result of government intervention.

Opportunities

The primary opportunity we see in 2017 is unquestionably on the sell side.

Current market conditions present an excellent opportunity for those looking to downsize in the coming years to lock-in their recent gains and secure an ideal retirement home before masses go into competition and bid up prices on patio homes and ranchers in the next decade.

Now is also a smart time for investors to take some money off the table in anticipation of a market correction in years to come or alternatively to move into other markets that appear to have more immediate upside potential. Without a substantial down payment, finding cash flowing residential properties is nearly impossible. It is our view that purchasing a negative cashflow property has only one certainty...You will lose money...While we don't know how long this will be the case as rents generally do rise over time, buying a home and speculating that prices will rise in the coming years is a flawed strategy when you could buy in other markets or asset classes (eg. commercial) and guarantee positive cash flow.

For buyers, as noted above we see opportunity for downsizers to potentially secure their retirement residence at decent price levels. Yes prices are up for all asset classes, but you are better to sell high on the higher priced property, and buy high on the lower priced property than sell lower, and buy lower down the road. For example if you sell a larger home for $600,000 and buy a townhome for $300,000, you have an additional $300,000 to fund your retirement. If the market corrects 10% across the board, you now sell for $540,000, buy for $270,000 and have only $270,000 remaining to fund your retirement. It is also important to note that given the demographics, the buy lower option may never come.

We are by no means suggesting that now is the time to sell for everyone, as individual circumstances differ, as do investment objectives, etc. Remember, we all need a place to live and over time real estate generally appreciates. We just know there are peaks and valleys and we have every reason to believe we are closer to the peak than the valley. For a consultation specific to your situation, please feel free to contact us anytime.

If you have any questions about market conditions or would like more details specific to your neighbourhood, please contact us at info@jahelkagroup.com and we would be happy to help.

Source: VIREB


Dec. 7, 2016

Nanaimo Monthly Market Recap: Nov 16


NO REAL SURPRISES IN NOVEMBER AS TRENDS CONTINUE


Single Family Prices and Volume

98 single family homes were sold in November, down 8% from the 108 sold in the same time frame last year, and 14% less than were sold last month, which is not surprising given the time of year with the holidays approaching. The average sale price for a single family home remained stable at $472,137, down less than a percent ($1,088) from October, and still up almost 18% from the November 2015 average of $400,977.  That said, the movement in the average price isn’t the only determining factor in assessing the strength of a market. The median sell price is relied upon as a secondary measure which will not be skewed by a few high priced homes selling at the top end of the market and November’s median price was $445,000, down approx. 1% month-over-month and almost 25% above last year’s figure. The variance between the median and average sale has closed considerably from levels experienced earlier in the year, suggesting that prices at the lower end of the market continue to climb at an accelerated pace.

Strength of the Trend

Factors we also look at when analyzing a market to validate its strength are sell/list ratio; sell price; days to sell, and current inventory numbers:

The sell/list ratio was flat month-over-month at 77%, but down nearly 26% year-over-year, although November 2015 was abnormally high at 104% and a strong leading indicator of the demand that followed into early 2016. 77% is still a very respectable number, suggesting market conditions remain relatively strong.

The sell price/list price remained strong at 99%, as was the case in October. This figure was up from 96% a year earlier, suggesting there is still sustained upward pressure on pricing.

The average number of days on the market  increased from 20 to 26 month-over-month, however it was down from 50 days in November 2015, representing a 48% decline year-over-year, suggesting that attractive offerings continue to sell far quicker than seen over the past number of years and explaining why buyers still need to act quickly to avoid missing choice opportunities. Of note, entry level homes around the $300,000 mark continue to see frequent multiple offer situations, making it all the more vital that buyers are prequalified for financing and ready to act when they see a property they would like to move on.

The number of active listings is down to 229 from 233, and inventory numbers are down nearly 17% from November 2015’s levels. However, it should be noted that the gap is closing as October saw a year-over-year decrease of 39%. With subdued inventory levels, it is no surprise that buyers continue to struggle to find suitable properties.

Top Performing Neighbourhoods & Categories

In November, of the 18 sub-areas defined by the real estate board in Nanaimo, 39% saw an increase in the average selling price between October and November, and 83%, or 15 of the 18 saw increased prices year-over-year. Despite the headlines, not all neighbourhoods are moving in the same direction all the time. With real estate being location specific, it is vital to know what is going on in your area when determining whether the timing may be right to sell your home. For buyers, neighbourhoods will experience differing price action throughout the cycle. Again, it pays to know what is happening in each sub-area, to determine whether a purchase would be prudent.

For single family homes, at the lower end of the pricing spectrum Uplands, South Nanaimo, and South Jingle Pot all experienced strong month-over-month and year-over-year average price increases.  Consistent top performers North Nanaimo and more notably Departure Bay experienced strong months, with Departure Bay up nearly 16% month-over-month and nearly 37% year-over-year, albeit on lower volumes. Departure Bay continues to be ripe for revitalization as the area with an ideal location, lifestyle, and views is restored to its former glory. With limited inventory, homes continue to go quickly and multiple offer situations are not uncommon.  

Lots were undoubtedly the top performing category in November, up nearly 25% from October and up 45% year-over-year on increased volume. Given the rapid price escalation and limited inventory numbers it is not a huge surprise that lots are leading the way at this stage in the cycle. At this point, It is important to caution aspiring developers that lots are often the last to rise in a real estate cycle, and will also be the hardest to unload if you get caught in a correction as profit margins evaporate. Year-over-year, the average prices across all categories are up between 17% (single-family) and 45% (lots), impressive numbers to say the least.

Opportunities

Historically, December and January see the lowest number of transactions throughout the year as the holiday season and miserable weather keep buyers on the sidelines. Despite this, job relocations, growing families, separations, and estate liquidations still result in a solid number of motivated sellers eagerly awaiting a buyer. In a strong market such as we are experiencing, this may be a chance for an opportunistic buyer or investor to find a decent deal. Watch for price drops to signal motivation. Many think that waiting until spring to buy may result in additional choices with more listings. What they fail to take into consideration is competition as the number of buyers looking will significantly increase as well. If you have been frustrated by losing homes in multiple offer situations, the next month or two could be a window for you to get in without having to fight the competition.  Looking back to the past couple of years, the buyers we represented in the winter months secured some of what now appear to be the best deals of the respective years.

If you have any questions about market conditions or would like more details specific to your neighbourhood, please contact us at info@jahelkagroup.com and we would be happy to help.

Check out the Nanaimo Market Statistics Here

Source: VIREB


Nov. 19, 2016

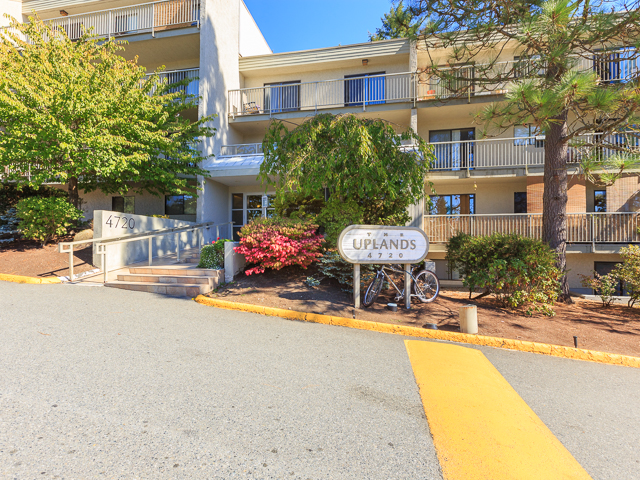
Investment Property Analysis: 405-4720 Uplands Drive, North Nanaimo


405-4720 Uplands Condo for Sale

Real Estate Investors are increasingly finding it challenging to find Nanaimo Real Estate that still has the potential to cash flow while making use of financing to maximize their leverage. 

This 1 bedroom, 1 bathroom condo located in desirable North Nanaimo is within walking distance to malls, shopping, restaurants, jobs, and public transportation. Offering 716 sqft. of living space with its own balcony, this unit is currently rented for $825/month and the tenant would be to stay making, making this a turn-key real estate investment opportunity.

Offered at $139,900, here’s a financial breakdown of what the numbers would look like:

Assumptions:

  • Purchased for $139,900
  • 20% down payment
  • Financed on a 2.5%, 5-year, fixed rate, 25 year amortization, resulting in a monthly mortgage payment of $501
  • Stata fee is $160
  • Taxes (2016) are $1,012 annually / $84.33 monthly
  • Vacancy allowance of 3%: $24.75 per month
  • Maintenance allowance of 5%: $41.25 per month

Initial Investment:

$27,980 down payment

$1,399 land transfer tax

$1,000 lawyer fees (approx.)

$400 home Inspection (approx.)

$30,779 total

Income/Expenses (monthly):

  $825 rent

- $501 mortgage payment

- $160 strata fee

-   $80 property taxes

-   $25 vacancy allowance

-   $41 maintenance allowance

    $18 total 

Ultimately, your return on your $30,779 will have 3 components: 


  1. Building Equity / Paying down the principal: At the end of 5 years, you will have paid the principal down by $17,193
  2. Cashflow: $18/mo. until rent is increased or costs rise. Vacancy rates are currently very low in Nanaimo, so if these factors persist, rents could be reasonably expected to continue to increase.
  3. Capital Appreciation: The exact timing of future market conditions is unknown, however, over time real estate values will rise. Over the past 5 years, condo values in nanaimo have increased approx. 16%, or approx 3.25% per year. If this trend continued, it would result in a property value of $162,284 after 5 years, a gain of $22,384.

Of course, none of these numbers are guaranteed as markets do go both up and down. However, taken together you can see that your principal paydown, cashflow, and capital appreciation, work together to deliver a potentially substantial return on the $30,779 initially invested in this scenario. 

Although in this scenario we maximized the financing available for a rental property investment at 80% loan-to-value (LTV), a more sizeable down payment would only serve to increase the monthly cashflow. It should also be noted that the vacancy and maintenance allowance are not actual cash expenditures, but serve more as a safety net so that there are no unexpected surprises down the road - a prudent measure for all real estate investors to factor into their financial analysis. 

With it’s prime location and cash flow potential, this North Nanaimo investment property is definitely worth a look. Please contact Real Estate Advisor Carlee Jahelka *PREC at 250-616-1020 for more information on 405-4720 Uplands Drive.

Turn-key investment condo for sale at 405-4720 Uplands Drive

Note: All figures are approximate, used for illustration purposes and no suggestion of likely or guaranteed investment returns are being offered or should be relied upon. 


Nov. 9, 2016

Incredible Value in Nanaimo Real Estate

NANAIMO'S REAL ESTATE MARKET - WHERE VALUE AND LIFESTYLE DON'T HAVE TO COME AT A PRICE

No one will dispute the obvious value in Nanaimo’s Real Estate Market especially when compared to neighbouring high profile markets where local homeowners are being priced out of the housing market.  Offering all the amenities you can expect from an up and coming city along with some of the best recreational activities imaginable, there are lots of unique neighbourhoods and a variety of housing options to choose from, making Nanaimo the location of choice for those seeking value for their housing dollar and a great lifestyle to match....

An exceptional, modern, custom-built home in Nanaimo:  4 beds | 4 baths | 2,982 sqft of West Coast living at its finest


A contemporary living space with high end fixtures and finishings 

An entertainer's dream outdoor space: a sizeable deck | natural gas fire pit & BBQ | hot tub

And all this for under $800k....

What would this cost just 20 minutes away by float plane!!

For more information on this spectacular property, click Here.

If you are considering a move or are new to the area we encourage you to contact an advisor from the Jahelka Real Estate Group to help you navigate through the options available to you in Nanaimo’s Real Estate Market - providing exceptional client care and local market knowledge we will ensure you have the resources and the most current information available to make the most informed Real Estate decisions.


Posted in Island Living
Nov. 4, 2016

Nanaimo Monthly Market Recap: Oct 16


 UPWARD PRESSURE ON PRICING CONTINUES WITH TRENDS SUGGESTING PRICES AT THE LOWER END OF THE MARKET ARE INCREASING… 

Single Family Prices and Volume

114 single family homes were sold in October, 3 less than were sold in the same time frame last year, and 28% less than were sold last month, contrasting with last October which actually saw a 7% volume increase from September. Despite the substantial decrease in homes sold in October, the average sale price for a single family home remained comparatively stable at $473,203 compared to $476,691 in September. However, it is worth noting that this is still up almost 23% from the October 2015 average of $385,099.  That said, the movement in the average price isn’t the only determining factor in assessing the strength of a market. The median sell price is relied upon as a secondary measure which will not be skewed by a few high priced homes selling at the top end of the market and October’s median price was $450,000, which is a 7% increase month-over-month and almost 24% above last year’s figure. It is interesting to note that the variance between the median and average sale price of $23,203 is the closest it has been so far for 2016, suggesting that prices at the lower end of the market are increasing.

Strength of the Trend

Factors we also look at when analyzing a market to validate its strength are sell/list ratio; sell price; days to sell, and current inventory numbers:

The sell/list ratio decreased month-over-month by over 11%, and year-over-year by 6%, from 87% in September 2016 and 82% in October 2015 to 77% in October of this year. 77% is still a very respectable number, suggesting market conditions remain relatively strong. 

The sell price/list price actually increased by 1% to 99% in October after sitting at 98% for the previous 2 months; this is up 4 points from 95% in October of last year. This figure suggests there is still sustained upward pressure on pricing. 

The average number of days on the market continued to decline, down to 20 days from 24 in September.  This represents an almost 17% decline month-over-month and a 57% decline year-over-year with the average home on the market for 46 days in October 2015, suggesting that attractive offerings continue to sell far quicker than seen over the past number of years and explaining why  buyers still need to act quickly to avoid missing choice opportunities. 

There was no change in current inventory numbers - still at 233 active listings in October, but down almost 39% from October of last year  which explains why buyers continue to struggle to find suitable properties. Lack of inventory is one of the primary drivers of the upward pressure on pricing as buyers compete for a limited supply of properties. 

Top Performing Neighbourhoods & Categories

In October, of the 18 sub-areas defined by the real estate board in Nanaimo, 44% saw an increase in the average selling price between September and October, and 89%, or 16 of the 18 saw increased prices year-over-year. Despite the headlines, not all neighbourhoods are moving in the same direction all the time. With real estate being location specific, it is vital to know what is going on in your area when determining whether the timing may be right to sell your home. For buyers, neighbourhoods will experience differing price action throughout the cycle. Again, it pays to know what is happening in each sub-area, to determine whether a purchase would be prudent.

For single family homes, Hammond Bay, Brechin Hill and Extension were the top performers.

Patio homes were undoubtedly the top performer categorically, and the only housing category that saw positive month-over-month results both in terms of price and volume, up over 20% and 200% respectively in October. However, it should be noted that  all categories with the exception of apartment style condos saw a year-over-year increase in average sale price.

Opportunities 

With upward pressure on pricing remaining strong, driven by solid demand and limited supply, we view purchases in the Nanaimo market for investment purposes at this point in the market cycle as speculative. Without a very low-ratio mortgage, finding cash flowing residential investment properties are nearly impossible. In other words, if you are buying a rental property in Nanaimo in October 2016, the only guarantee you have is that you are going to lose money every month, basically crossing your fingers that the market is going to continue upwards despite no underlying economic support for it to do so. Factor in recent government intervention in lending, which will result in buyers qualifying for significantly less on their mortgages, and the outlook is not overly optimistic. This is not to say we don’t have another 6 months, 1 year, even 2 years left in the current run. Timing is what is most challenging to predict. The outcome is not…

The reality is the markets will peak, and they will turn downwards. Real estate markets are cyclical, and this move is inevitable, it’s just a matter of when. What we always tell investor clients who are thinking of selling is to pick a number and stick to it, because if the market turns and you get caught, there is a good chance you will ride it down, in hopes of one day getting back to the number that you happily would have sold at in the first place. If this section sounds like a near repeat of last month’s market update, it’s because it is. We want to hammer this point home...Despite what the average Realtor will tell you (who is also feeding their family based on real estate commission cheques), we are not at the start of a 7 year cycle...

So if it is not abundantly clear by this point in this section, we see opportunities on the sell side, leveraging low inventory numbers and rising prices to maximize recent gains. While investors often try to maximize their portfolio growth by timing the top, the better approach is often a more defensive strategy, whereby you look to lock in reasonable gains and protect your downside risk exposure. We are by no means suggesting that now is the time to sell for everyone, as individual circumstances differ, as do investment objectives, etc. What we are saying is that if you are risk averse, and seeing an investment property value down $50,000 - $100,000 from its current value would cause you to lose sleep at night, the fall market may present you with a good opportunity to get out with a very respectable return. For a consultation specific to your situation, please feel free to contact us anytime.

If you have any questions about market conditions or would like more details specific to your neighbourhood, please contact us at info@jahelkagroup.com and we would be happy to help.

Check out the Nanaimo Market Statistics Here

Source: VIREB


Oct. 1, 2016

Nanaimo Monthly Market Recap: Sept 16

 NANAIMO AVERAGE PRICE UP NEARLY 22%, VOLUME UP 45% YEAR-OVER-YEAR

Single Family Prices and Volume

158 single family homes were sold in September, down 5% over August, but still up 45% when compared to the same time frame last year when only 109 homes were sold. Despite the marginal decrease in homes sold in September, the average sale price for a single family home increased to $476,691; representing a 5.1% increase from August’s average of $453,729, and up almost 22% from the September 2015 average of $391,803. It is certainly not uncommon to see market trend improvements in the fall after the summer’s traditional slow down but it should be noted that the average selling price has reached an all time high when compared to recent history.  That said, the average price increases aren’t the only determining factor in assessing the strength of a market. The median sell price is relied upon as a secondary measure which will not be skewed by a few high priced homes selling at the top end of the market and September’s median price was $421,000, a less than 0.5% increase month-over-month, although 14% above last year’s figure. The variance between the average and median prices suggests that once again, there is strength at the higher end of the market.

Strength of the Trend

Factors we also look at when analyzing a market to validate its strength are sell/list ratio; sell price; days to sell, and current inventory numbers:

The sell/list ratio decreased slightly month-over-month from 91% in August to 87% in September, although more importantly, was up from 63% a year earlier. 

The sell price/list price settled at 98% again in September. This is down slightly from the 100% we were seeing earlier this year, however with prices continuing to rise and sellers stretching their asking prices to maximize their returns on the back of strong market conditions, this slight adjustment downwards is not unexpected.  The sell price/list price was still up 2 points from 96% in September of last year. 

The average number of days on the market continued to decline, down to 24 days from August’s 27, representing an 11% decline month-over-month and a 35% decline year-over-year when in September 2015 homes were on the market for an average of 37 days, suggesting attractive offerings continue to sell far quicker than we have experienced over the past number of years, requiring buyers to be on the ball to avoid missing choice opportunities. 

Current inventory numbers continue to drop, with 233 active listings in September. This deviates from the typical September surge we have come to expect as kids return to school and families return from their well earned summer vacations. September was down significantly from the 272 active listings in August (which was itself down significantly from 327 in July), signaling little relief for buyers who continue to struggle to find and secure properties; in comparison during the same time frame last year, there were 439 active listings on the market. In other words there are only 53% as many listings as there were for sale last year at this time and there is significantly more buyer interest to satisfy…Great for sellers, not so much for buyers...

Top Performing Neighbourhoods & Categories

Of the 18 sub-areas defined by the real estate board in Nanaimo, 50% saw at the very least a minimal increase in the average price between August and September,  with a third of the sub-areas experiencing an increase in volume month-over-month.  14 of 18 areas had average prices up year-over-year, with 10 of 18 showing stronger volume than the same time last year.  When considering selling your home, it is so important to know what exactly is going on in your area, as real estate is so location specific and not all neighbourhoods are benefiting from the current boom to the same extent. 

For single family homes, North Nanaimo, the Old City and Diver Lake were some of the top performers when both price and volume were taken into consideration.  

The housing categories that led the way in September were apartment style condos, up  almost 18%. Townhouses also had a strong showing up 7%, as did waterfront homes which saw a nearly 14% increase month-over-month, pulling the average price of a waterfront home back up over a million,  further contributing to the 30% rise we have seen in the average price of waterfront homes over the past year. 

Opportunities 

With prices continuing to soar and inventory numbers continuing to decrease, we view purchases in the Nanaimo market at this point in the market cycle as speculative. Without a very low-ratio mortgage, finding cash flowing residential investment properties are nearly impossible. In other words, if you are buying a rental property in Nanaimo in September 2016, the only guarantee you have is that you are going to lose money every month, basically crossing your fingers that the market is going to continue upwards despite no underlying economic support for it to do so. Factor in recent government intervention in lending, which will result in buyers qualifying for significantly less on their mortgages, and the outlook is not overly optimistic. This is not to say we don’t have another 6 months, 1 year, even 2 years left in the current run. Timing is what is most challenging to predict. The outcome is not…

The reality is the markets will peak, and they will turn downwards. Real Estate markets are cyclical, and this move is inevitable, it’s just a matter of when. What we always tell investor clients who are thinking of selling is to pick a number and stick to it, because if the market turns and you get caught, there is a good chance you will ride it down, in hopes of one day getting back to the number that you happily would have sold at in the first place. 

So if it is not abundantly clear by this point in this section, we see opportunities on the sell side, leveraging low inventory numbers and rising prices to maximize recent gains. While investors often try to maximize their portfolio growth by timing the top, the better approach is often a more defensive strategy, whereby you look to lock in reasonable gains and protect your downside risk exposure. We are by no means suggesting that now is the time to sell for everyone, as individual circumstances differ, as do investment objectives, etc. What we are saying is that if you are risk averse, and seeing an investment property value down $50,000 - $100,000 from its current value would cause you to lose sleep at night, the fall market may present you with a good opportunity to get out with a very respectable return. For a consultation specific to your situation, please feel free to contact us anytime.

If you have any questions about market conditions or would like more details specific to your neighbourhood, please contact us at info@jahelkagroup.com and we would be happy to help.

Check out the Nanaimo Market Statistics Here 

Source: VIREB