Sept. 7, 2017

Nanaimo Market Statistics August 2017

Market Indicators Either Flat or Down for 3rd Consecutive Month

 Single Family Prices and Volume

138 single family homes sold in August, down 17%  from the 166 sold in the same timeframe last year and down 9% from the 152 that sold in July. Given the time of year when people are out enjoying the summer, the continued slowdown is not unexpected, however, it is interesting to note that in 2016 volume reached its summer bottom in July. After 3 months hovering around the $525,000 mark, the average sale price for a single family home dipped slightly (1.11%) in August to $518,612, which was an increase of 14% over last year’s August figure. August’s median price of $495,000 was an increase of 2% from July’s median price of $485,000 and an increase of nearly 18% from last August. While not as pronounced as July’s year-over-year figures, we are still talking about sizable gains here.

Strength of the Trend

Factors we also look at when analyzing a market to validate its strength are sell/list ratio; sell price; days to sell, and current inventory numbers:

The sell/list ratio dipped a further 7% from July to 63%, more notably, this represented a 31% decline from the 91% posted in August of 2016.

The sell price/list price held at 99% month-over-month, one point up from the 98% figure for August 2016.  August’s figure is not suggesting every home is selling at 99% of the asking price as it is just an average, with some selling well below asking, and the most attractively priced offerings going into multiple offer situations and selling above the list price in many cases. For a general frame of reference, typically anything 96-97% and above reflects strong market conditions.

The average number of days on the market increased by 20% from July to 24 days. This figure is still 11% lower than that of last August, suggesting homes on average sold a few days quicker than they did last August.  

As of the end of August, the number of active listings is 342, up 2% from July and 26% from inventory levels at the same time last year.  This is a trend that will be important to watch as this is the third consecutive month where we have seen heightened year-over-year inventory levels. The number of new listings has also been rising year-over-year, with the past 3 months experiencing accelerated increases in percentage rises over last year’s new listing numbers. With lack of supply being a major driver of recent price gains, it will be interesting to see whether rising inventory levels continue leading to more balanced market conditions in the coming months.

While the figures in this section remain strong by historical standards, it should be noted that for the third consecutive month, each month-over-month metric was either flat or inferior. While this is not completely unexpected given the time of year and extended heat wave we have experienced making it more attractive to be at the beach than touring properties, it does undoubtedly put our team on alert to be watching for behavioural signs from our clients that buyer sentiment may be changing. Keeping a close eye on the market over the coming months will help determine whether this month’s conditions are just continued seasonal cooling or the start of a larger trend. September will be an important month to watch as historically it has been a good indicator of the strength of the fall market.

Only Found Here

Days on Market:

  • Selling in 0 - 7 days:
    • Single Family: 41% at an average of 101.07% of the list price.
    • Condo/Strata: 38% at an average of 100.18% of the list price.
  • Selling in 8 -31 days:
    • Single Family: 31% at an average of 99.41% of the list price.
    • Condo/Strata: 44% at an average of 99.95% of the list price.
  • Selling in more than 31 days:
    • Single Family: 28% at an average of 97.88% of the list price.
    • Condo/Strata: 17% at an average of 97.39% of the list price.

Sell Price/List Price:Sold above list price

  • Sold above list price:
    • Single Family: 27% of homes sold above the asking price - at an average of 3.98% above ask, with 16% the highest premium paid. The average days on market for those selling above the asking price was 24, although this was skewed by 2 that required 100+ days to sell.
    • Condo/Strata: 27% of condos sold above the asking price at an average of 3.29% above ask. The highest premium paid was 10%, and the average days on market for those selling above the asking price was 13.
  • Sold at the list price:
    • Single Family: 14% of homes sold at the asking price in an average of 9 days.
    • Condo/Strata: 24% of condos sold at an average of 42 days on the market.
  • Sold below the list price:
    • Single Family: 59% of homes sold, taking an average of 28 days.
    • Condo/Strata: 49% of condos sold, taking an average of 24 days.

There are clearly some key takeaways here:

  1. Homes are not selling nearly as quickly as they did in the spring market
  2. The percentage of homes selling above the asking price is significantly less than what was occurring earlier this year.
  3. The majority of single family homes and nearly half of the strata properties sold below the asking price.
  4. There is a strong correlation (or inverse relationship if you would like to get technical) between days on market and sell/list price. In general, the lower the days on the market, the higher the price relative to list price. Homes selling well below the asking price (that were overpriced by greedy sellers with unrealistic expectations) are sitting on the market for a significant amount of time as the seller’s expectations normalize over time.

What this means for Buyers: At some price levels and locations, you may have an opportunity to have more than an hour to decide if you want to pull the trigger and enter into a bidding war. In fact, there may be increasingly more opportunities to find a home without competition and potentially find a deal here and there under the asking price. However, buyer demand remains strong, so if you are a serious buyer, you need to be pre-approved for a mortgage and very clear on what you are looking for so that you can offer immediately on the best new options hitting the market.

What this means for Sellers: You need to price accurately to maximize interest, especially with the number of active listings climbing to near 2-year highs. This is not the “leave a little room for negotiation” market. Pricing accurately will minimize the days on market (and inconvenience to your family), as well as best position you for a competitive bidding situation. Working with a Realtor with a very strong marketing platform is vital, as is working with an experienced negotiator who can guide you through a potential multiple offer situation.  

Top Performing Neighbourhoods & Categories

15 of the 18 sub-areas defined by the real estate board in Nanaimo saw an increase in the average selling price (trailing 12 months) from July to August, with all 18 experiencing increased prices year-over-year.  These annual increases range from 5.63% in Hammond Bay to 33.63 % in the Old City. Top risers month-over-month were Extension, North Jinglepot, South Nanaimo, Old City, and Brechin Hill. Top performers year-over-year were Old City, Central Nanaimo, South Jinglepot, North Jinglepot, and South Nanaimo. Similar to last month, and more so than in previous months, the top performers seem somewhat scattered, with no strong correlation among top performing areas. Looking at volume, risers both monthly and annually included Uplands and Lower Lantzville.

On low volume, for the second month in a row water front homes led in both average month-over-month and year-over-year increases as buyers are captivated by the oceanfront lifestyle that is so attractive this time of year. Month-over-month. Single family, townhouses, and lots all saw declines, with apartment style condos and patio homes experiencing marginal increases. Year-over-year, all categories experienced gains in average prices, with townhomes and single family homes having sizeable gains, in addition to the strong price action on water front homes previously noted.

Opportunities

Heading into fall, we remain undoubtedly in the midst of a SELLER’s market. We continue to see the opportunities firmly on the sell side. If you have previously listed a property that didn’t result in a sale, the fall market may be the perfect opportunity to re-enter the market.

With that said, if you have been following our commentary, you are well aware that the past 3 months have all exhibited flat or deteriorating market conditions across a variety of metrics. While this is not completely unexpected given the time of year, it is a trend to monitor and adds fuel to the fire that we may be nearing a top in the current cycle. Across the country, volume has slowed in major markets, and just this morning the Bank of Canada has announced the second rate hike this summer. With affordability already a challenge, rising interest rates will surely impact the ability of buyers to qualify for mortgages as levels needed to get them into their desired categories of housing. There is also talk that non-insured mortgages may soon require buyers to qualify at the substantially higher qualifying rate, which is currently only applicable to insured, high ratio mortgages. The byproduct of this is less investment capital flowing into the real estate market. Less demand = reduced upward pressure on pricing. So what are we getting at...While, if you are an investor or downsizer trying to maximize your gains and time a market top, there are warning signs suggesting now may be the time. Whether it’s the stock market or the real estate market, timing the top is a fool’s game. It is impossible even for the best of the best. You can look at all the past trends and analysis you want, but if unforeseen circumstances such as government intervention, a natural disaster or major international conflict get in the way, conventional wisdom goes down the toilet. When managing your assets, protecting your downside is every bit as important, if not more than chasing gains on the upside. Remember a decline of 50% requires an increase of 100% just to break even. Selling near the top also positions you to “go shopping” when the market is “on sale.” This is how real acceleration is possible when building your portfolio. While this market may still have some room to run to satisfy the built up demand from the spring market, there is no doubt that it will turn at some point. It always does, markets are cyclical, it is not different this time… Make sure you are protected.

For buyers, the number of active listings is the highest it has been since the fall of 2015. Throughout the summer, we noticed in some cases that competition has somewhat dissipated on the buy side, and homes don’t seem to be snatched up as quickly, supported by rising average days on market. More listings equals more choice for buyers and potentially the opportunity to secure a home without enduring excruciating bidding wars and ultimately overpaying to have an offer accepted. However, September traditionally sees families return to the routine and often has decision makers re-evaluating major life decisions, such as whether it is time to make a move. This often drives fairly robust buyer demand in the early fall months, before buyers and sellers retreat to the sidelines for the holiday season, so this window may close fairly quickly as we head towards the latter part of the month.


For a consultation specific to your situation, or if you have any questions about market conditions, please contact us at info@jahelkagroup.com and we would be happy to help.

Check out the Nanaimo Market Statistics Here: Monthly Stats Nanaimo August 2017

Source: VIREB

Aug. 4, 2017

Investor Insights

Property Management: Is It Worth It?

For residential property investors on Central Vancouver Island, the last two years has been exhilarating for those with a sizeable portfolio, while increasingly challenging for those patiently waiting for the right property to come along and in the process chasing the market up. Currently, you have about as much chance of finding cash flowing residential property without a sizeable down payment around here as the Canucks do of making the playoffs next spring...while not technically impossible, highly unlikely.

While returns are still far more attractive on a cash-on-cash basis than you would find in the Lower Mainland, the fact is margins are very thin and it has never been more important for investors to watch their spending to make the numbers work. So...how about that 10% property management expense? At first thought, it may seem like the property management expense is the surest way to ensure that your investment property will not cashflow. After all, the rental market is competitive, so place an ad on Craigslist, lock the tenants into a 1 to 2 year fixed term, and watch the rent cheques roll in… If you are currently managing your own portfolio, I can feel your eyes rolling through your screen. You know it is not that easy. In fact, tenant relations, maintenance issues, and general property management are the primary reason many investors avoid investing in the #1 wealth building asset class in the world. You’ve all heard the horror stories… the toilet floods at 2:00 am, the tenants disappear in the night without paying rent, the property unknowingly becomes a grow op… Over the past eight years or so, I have personally had quite a few tenants. While some were outstanding, I could probably write 2 or 3 blog posts about the horror stories and keep you thoroughly entertained, this despite being quite diligent with background checks on our tenants.

Maybe you are great with people, maybe you are extremely handy and can fix just about anything, maybe you are retired and enjoy having something to get up for in the morning, whatever the case may be, I am sure property management services are not necessary for all investors. However, if you are not investing in the #1 wealth building asset class that some say has created 90% of all millionaires because of the hassles involved with “active management,” you are really missing an incredible opportunity to secure your financial future. In my former life sitting on the other side of the fence working with primarily high net worth investors helping them build their wealth, I would attend sponsored seminars whereby we were wined and dined by some of the largest hedge fund and mutual fund managers in Canada. Part of the pitch they were trying to cement in the minds of the financial advisors in the room was that managed funds offered investors a very low-cost way to have the top money managers in Canada secure their financial future. No stock picking, no fixing toilets in the middle of the night, just set up that pre-authorized contribution and enjoy the margaritas on the beach in retirement.

Last year Morningstar determined that the average Management Expense Ratio (MER) on equity mutual funds in Canada is 2.35%. In comparison to the 10% charged for property management, that seems relatively cost effective. However, you are not comparing apples to apples. The 10% is on rental income actually generated. The 2.35% is on assets under management. Good, bad, 2008 when your portfolio is down 40% and you now have to work an extra decade to fund your retirement... you’ve got it, they are taking the 2.35% plus additional fees not included in the MER calculation. Translated to real estate, this would be like paying 2.35% of the value of your home each year to the manager regardless of whether the value goes up or down. On a $500,000, that is $11,750 per year. In this market, a $500,000 home would likely generate about $2,000 a month in rental income, $24,000 per year. 10% of that is $2,400, just over 20% of the cost that would be charged on the same asset value in the average equity mutual fund. That’s right when you do compare apples to apples, you are paying nearly 5x as much for fund management as you would likely be paying on a real estate asset of the same value and you have likely been doing so unknowingly for many years. I am sure you would be surprised to know that a 2016 survey by Nest Wealth determined these fees could cost the average Canadian household approximately$323,655 over their investing lifetime, about $80,000 more than the average household spends raising a child to the age of 18. Have I made my point? There is a significant cost incurred to invest in the financial markets. If turning over your hard earned money trusting that our financial service sector will ensure you a secure retirement with you taking all the risk and the fund managers taking their cut regardless of performance is something you justify as the cost of doing business, isn’t the services of a property manager who is ultimately paid for performance well worth the cost?

As far as I am concerned, all investors should be calculating in the cost of property management when evaluating properties for potential investment. If you are a regular reader of our Investor Insights series, you will know that I don’t recommend investing in properties unless the numbers make sense. In other words, clear cash flow potential after all costs have been considered (including 10% property management & 10% maintenance). There are real estate investment gurus out there suggesting that if a property is not generating annual rental income that is at least 10% of the initial cost of the property, you shouldn’t even consider it. While this may seem ludicrous and nearly impossible, it just shows you how over inflated our current market is. In Nanaimo, you would be lucky to get 5%. However, look outside of Vancouver Island, the Lower Mainland, the Okanagan, and as long as you avoid Toronto, you have a shot. I often hear people say that they only invest in their own backyard, they like the security of being able to drive by and check on their own properties. What I’d ask those folks is whether they hold any global funds or shares of international companies in their retirement accounts? Do they go visit the head offices of these global holdings and sit down to chat with the CEO to ensure they are being run to their satisfaction. No, of course not, that very notion is ridiculous, why would you need to do that when there is a professional money manager looking after the investment for you?...My point exactly...You can invest in real estate in Nanaimo, in other communities on the Island, across the country, and in many nations around the globe. In fact, by doing so you would be diversifying your holdings and could receive substantially higher returns. How would you go about doing so? Property management.

At the end of the day, the property management decision is up to you. If the hassles of property management are going to prevent you from investing in real estate in favour of the convenience of turning over your money to a well-compensated fund manager (who is taking 20-30% of the profits with 0% of the risk), I would suggest you may want to reconsider your approach. Real Estate has created more wealth in this world than any other asset class, and that is not likely to change anytime soon.

If you are considering an investment in real estate or need some assistance in developing a plan of action, put our team to work for you. Need property management services, we’ll point you in the right direction. Contact us anytime for your complimentary consultation at 250-751-0804 or info@jahelkagroup.com.

Aug. 4, 2017

Nanaimo Market Statistics July 2017

Average Home Price Flat Month-over-Month, Up 24% Year-over-Year

Single Family Prices and Volume

152 single family homes sold in July, up 3.4% from the 147 sold in the same timeframe last year, but down 17% from the 184 that sold in June. Given the time of year when people are out enjoying the summer, the slowdown is not unexpected. To provide some context, last July experienced a 27% decline from June in the number of homes sold. For the second month in a row, the average price came in very close to the previous month’s number at $524,435, down 0.4% from June. Again referencing last July’s numbers, the 27% volume drop was accompanied by an average price decrease of more than 9%. Year-over-year, the average home price in Nanaimo was up 24%...yes 24%, it wasn’t a typo, it was an incredible 12 months. July’s median price of $485,000 was a 3% pullback from June’s median price of $500,000, but still up 26% from last July. Again, wow...

Strength of the Trend

Factors we also look at when analyzing a market to validate its strength are sell/list ratio; sell price; days to sell, and current inventory numbers:

The sell/list ratio dipped slightly to 68% from 70% in June and was down nearly 6% from the 72% posted in July of 2016.

For the homes that did sell, for the first time since February, the sell price/list price notched down to 99% from 100%. 99% was consistent with last July’s sell price/list price. July’s figure is not suggesting every home is selling at 99% of the asking price as it is just an average, with some selling well below asking, and the most attractively priced offerings going into multiple offer situations and selling well above the list price in many cases. For a general frame of reference, typically anything 96-97% and above reflects strong market conditions.

The average number of days on the market increased by 1 day to 20. This figure is nearly 18% higher than that of last July, suggesting homes on average took a few days longer to sell than they did last summer.  

As of the end of July, the number of active listings is 336, up 4% from June, and 3% from inventory levels last year. There were 224 new listings in July, which was down 14% from June, but up nearly 10% from the number of homes that hit the market last July.

While the figures in this section remain strong by historical standards, it should be noted that for the second straight month, the month-over-month metric was either flat or inferior. While this is not completely unexpected given we are in the middle of summer and have had such a run of great weather making it more attractive to be at the beach than touring properties, it does undoubtedly put our team on alert to be watching for behavioural signs from our clients that buyer sentiment may be changing. Keeping a close eye on the market over the coming months will help determine whether this month’s conditions are just a seasonal cooling or the start of a larger trend.

Only Found Here

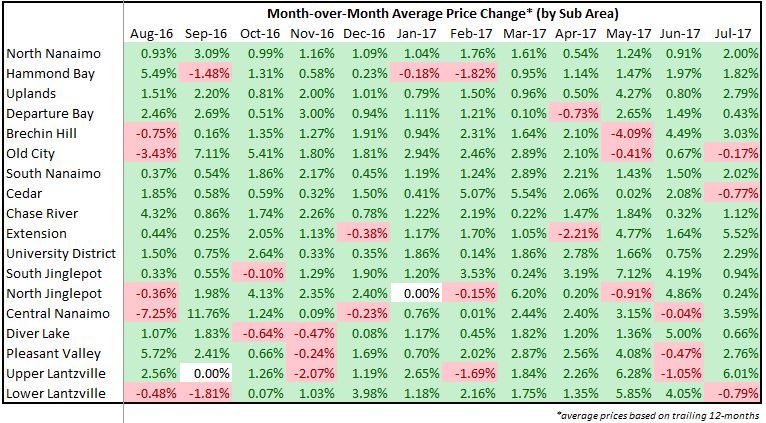
This month take a look at the various neighbourhoods in Nanaimo, more specifically the 18 sub-areas as defined by the real estate board and examine the month-over-month and year-over-year price changes for single family homes that have occurred.

These screenshots provide some insight into some of the proprietary tools our team relies on to stay on top of market conditions. The infographic is quite easy to interpret, basically if the average price went up over the previous period, the cell is green if the average price declined it is red.


Top Performing Neighbourhoods & Categories

15 of the 18 sub-areas defined by the real estate board in Nanaimo saw an increase in the average selling price (trailing 12 months) from June to July, with all 18 experiencing increased prices year-over-year.  These annual increases range from 11.88% in Hammond Bay to 27.57% in Pleasant Valley. Top risers month-over-month were Upper Lantzville, Extension, Central Nanaimo, Brechin Hill, and Uplands. Top performers year-over-year were Pleasant Valley, South Jingle Pot, Old City, North Jinglepot, and Uplands. More so than in previous months, the top performers seem somewhat scattered, with no strong correlation among top performing areas. Looking at volume, risers both monthly and annually included Hammond Bay, Old City, Cedar, Chase River, and Extension. One notable observation with the inclusion of Cedar, Chase River, and Extension is that activity remains strong in the South end of the city, likely as a result of buyers being priced out of more historically in-demand neighbourhoods. This is textbook market action for a maturing real estate market, as many buyers have now been priced out of the traditionally more in-demand neighbourhoods and are forced to expand their search to find a home in their price range. What is important to keep in mind is that in some cases these neighbourhoods have been the last to rise for a reason and will often be hardest hit when an inevitable correction occurs. This makes it vital for buyers to be working with an experienced realtor who will be able to steer you clear of areas to avoid.

On low volume, waterfront homes were the runaway leader in both average month-over-month and year-over-year increases as buyers are captivated by the oceanfront lifestyle that is so attractive this time of year. Townhouses, patio homes, and lots were all up year over year and month over month, with patio homes experiencing a noticeable spike in volume. If you’ve been following our commentary, you will not be surprised about this knowing that downsizing baby boomers are poised to drive demand for patio homes for years to come.

Opportunities

We remain undoubtedly in the midst of a SELLER’s market. We see the opportunities firmly on the sell side. If you have previously listed a property that didn’t result in a sale, now may be the perfect opportunity to re-enter the market.

One opportunity we see for Developers would be the creation of low maintenance, more luxurious patio homes or townhouse projects to satisfy the needs of downsizers and retirees moving to the area from other regions. So far this year we have been consistently speaking with potential sellers in the 50 -70 age range who are hesitant to sell because there are so few attractive options to move into. It is interesting in our market to note that for the past 20 or 30 years bigger has meant better. Townhomes were for lower income buyers and patio homes were the preceding step before the senior’s care facility. That is no longer the case. Empty nesters are spending too much money on utilities to heat homes for 2, and spending too much time cleaning and maintaining the yard to fully enjoy their well-deserved retirement. Time is valuable to baby boomers who are seeking meaningful experiences and the freedom to travel. They have the financial resources to afford higher end stratified properties, but these options are extremely limited.  

For buyers, continuing on from a trend we started to notice last month, competition has dissipated on the buy side, and homes don’t seem to be snatched up as quickly. Realtors under price properties quite frequently and for much of the spring, the market would have made up the difference, with buyers bringing offers well above the asking price. So here we are in July with buyers out enjoying the summer and the multiple offer situations are not occurring as frequently. There are more chances for buyers to make an offer and have it accepted at a decent price (relative to the market) without having to go into competition. Make sure you are working with a realtor who is on the ball to catch these rare opportunities, you’ll have to act quick.

For a consultation specific to your situation, or if you have any questions about market conditions, please contact us at info@jahelkagroup.com and we would be happy to help.

Check out the Nanaimo Market Statistics Here:  Monthly Statistics Nanaimo July 2017

Source: VIREB

July 7, 2017

Investor Insights

Rising Interest Rates: What Would This Mean for Investors?

In recent weeks, speculation over the Bank of Canada’s intention to raise interest rates has dominated much of the conversation in financial circles. At this point, it appears it’s more a question of when than if. There is now fairly strong sentiment from economists in the know that rates are poised to tick upwards for the first time in seven years on July 12 when the Bank of Canada next reviews rates. Whether it does happen later this month, later this year, or at some time beyond, when rates do rise, there are a number of potential implications for real estate investors. While it is challenging to determine the extent to which rising rates will impact the markets as interest rates are only one of many variables, we thought we’d highlight a few potential outcomes that could have implications for real estate investors:

1. Cap rates will rise: Rates of return on various asset classes are essentially comprised of the risk-free rate + a risk premium. The risk-free rate is theoretically the rate of return an investment with no risk of loss would command over a given period of time. Think T-bills or Government of Canada Bonds, depending on time horizon.The risk premium reflects the expected return that would be required for an investor to take on the added risk inherent in a particular investment or asset class. For example, junk bonds would require a higher risk premium than Government of Canada bonds in order to attract investors to make the investment. In other words, they would require a higher return to compensate them for the added risk. As the economy is ever changing, the risk premium between asset classes fluctuates. However, the risk-free rate component of total required rate of return is basically consistent across asset classes. Therefore, when interest rates rise, the risk-free rate rises, and therefore the overall total required rates of return rise. Capitalization rates in real estate are included in this equation. As the total return on other assets classes rise, stemming from increasing interest rates, real estate investors will expect a higher rate of return as well.

2. Valuations on income properties may drop: The most common way to value income producing property is using the income approach. Simply put, you capitalize the Net Operating Income (NOI). NOI / Cap Rate = Property Value. Therefore, if interest rates rise and cap rates rise, using this equation property values go down. For example, if your NOI is $100,000 on an apartment building at 4.5% cap rate in Nanaimo, your implied property value is $2,222,222. If cap rates on apartment buildings rise 1% resulting from a string of interest rate increases over the next year or two, the implied property value declines to $1,818,181, a substantial decrease. Now, there are those that argue that rising interest rates do not have a significant effect on property values, because interest rates are adjusted upwards when the economy is expanding to keep growth/inflation under control. Strong economic conditions would imply rents should be increasing, which would be increasing the NOI, possibly offsetting the impact of rising cap rates on valuation. I don’t buy it…while this may be the case in larger cities, real estate is location specific. There are regional disparities. Smaller communities such as Nanaimo can be impacted by local economic conditions, which would have a larger impact on rents than the macroeconomic conditions in Canada on which interest rate decisions are made. Further to that, I would argue that current Canadian economic conditions are not all that impressive, and it is the over-inflated real estate market that is largely driving much of small-town Canada, as well as playing a prominent role in major centres such as Vancouver and Toronto. In fact, it is this overheated real estate market that is driving much of the talk surrounding increasing interest rates in an effort to slow down the astronomical price increases we have been experiencing. Enough said, as interest rates rise, valuations have a good chance of moving downward. 

3. Residential buyer demand will decrease: In short, more people today qualify for financing on homes at higher price points than they will when interest rates rise. The average home price in Nanaimo has increased 43% since January of 2015. This has priced a good percentage of home buyers out of their preferred neighbourhoods and some buyers out of the market altogether. At the time of the most recent census, the average household income in Nanaimo was $65,690. Based on CHMC’s guideline of 32% GDS, this would suggest your total housing cost including mortgage, taxes and heat would need to be no more than per month $1,751 per month, likely leaving your mortgage payment around $1,400 after taxes and heating are considered. Currently, the benchmark qualifying rate for insured high-ratio mortgages is 4.64%. Therefore, the average household in Nanaimo would qualify for a mortgage of $249,900. Did I mention the average house price in Nanaimo was $526,000...Concerned anyone??? So what does a quarter point uptick in rates qualify you for? $243,500. A full point? $229,000 or 8.4% less than before. With recent price increases, a good percentage of buyers are red lining, which would suggest as buyers qualify for less, demand will fall. When demand falls, prices fall. But, isn’t that the point of the exercise...raising interest rates to get housing prices under control.

4. Demand for residential rentals may rise: If you can’t qualify to purchase a home, what do you do? You need somewhere to live. While you rent of course. More rental demand with a relatively fixed supply of rental apartments equates to rising rent levels. Not much more to say here.

There are so many variables impacting the real estate market that it is difficult to predict with certainty how rising interest rates will affect the market. For example, the internet has opened our real estate markets to an ever increasing number of international buyers which has never before been the case. Will the increasing international demand offset the domestic buyers priced out of the market or qualifying for less when purchasing? Hard to say… What we can say with relative certainty is that interest rate movements are likely to be a prominent story over the next 48 months that will most certainly impact the market. We’d strongly recommend that investors factor in the potential implications when exploring a purchase. For sellers not looking to hold long term, but rather looking to maximize your gains, now may be a good time to review your holdings. Trying to time the top of a market is an extremely risky proposition and you have the Bank of Canada clearly suggesting rates are poised to rise, with potential risks outlined above.


If you are considering an investment in real estate, put our full-service advisory team to work for you.  Contact us anytime for your complimentary consultation at 250-751-0804


July 6, 2017

Nanaimo Market Statistics June 2017


Market Conditions Stabilize in June

Single Family Prices and Volume

184 single family homes sold in June, up nearly 10% from the 204 sold in the same timeframe last year, but up 3% from the 178 that sold the previous month. Aside from a slight dip in April, volume has been increasing steadily from the beginning of the year. After a monster month-over-month average price increase from April to May of almost 6%, June’s average essentially flatlined, up a nominal $311 from May, but still an impressive 13% year over year. June’s median price of $500,000 was up more than 4% from May and nearly 14% from last June’s levels. With median prices again climbing, this suggests that home prices at the lower end of the pricing spectrum are on the rise, as competition for affordable properties continues to put upward pressure on pricing. For more on this, please check out our “Only Found Here” section of the report.

Strength of the Trend

Factors we also look at when analyzing a market to validate its strength are sell/list ratio; sell price; days to sell, and current inventory numbers:

The sell/list ratio held tight at 70% in June, down nearly 16% from the 83% posted in June of 2016.

For the homes that did sell, the sell price/list price remained at 100%, the same number achieved in both May 2017 and June 2016. June’s figure is not suggesting every home is selling at 100% of the asking price as it is just an average, with some selling well below asking, and the most attractively priced offerings going into multiple offer situations and selling well above the list price in many cases. For a general frame of reference, typically anything 96-97% and above reflects strong market conditions.

The average number of days on the market increased to 19 after bottoming out at 16 last month. Despite the increase, this figure is still down nearly 14% from last June.

As of the end of June, the number of active listings is 322, up 8% from May, and also an increase of nearly 5% from inventory levels last year. There were 261 new listings in June, which was up nearly 7% from last year’s figure of 245 for June.

While the figures in this section remain strong by historical standards, it should be noted that each month-over-month metric was either flat or inferior. While this is not completely unexpected as the busy spring market transition into summer holidays, it does raise some eyebrows. While one month’s results do not signal a reversal in market conditions, it will be important to monitor these figures in the months to follow. This market has experienced a rapid ascension over the past 30 months with average home prices in Nanaimo up 43%.  These substantial month-over-month increases that we have been experiencing are not sustainable long term. Keeping a close eye on the market over the coming months will help determine whether this month’s conditions are just a seasonal cooling or the start of a larger trend.

Only Found Here

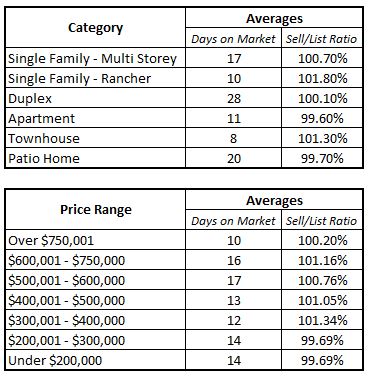
This month we took a look at various price points and property categories, examining both days on market and the sell/list ratio in an effort to determine if there were certain categories or price points that were significantly more competitive than others, or on the flip side, whether there were potentially some types of properties or price points where demand may not be as strong, thus exposing potential buying opportunities.

These numbers were taken from raw data provided by VIREB. Please note the highest and lowest days on market figures were removed from each category to reduce the impact of outliers in skewing the results.

In reviewing the findings, probably the biggest surprise was that there weren’t really any categories or price classifications that significantly outperformed or underperformed the other categories.  While there was some variance between categories, with only examining a month’s worth of data, the results are by no means conclusive.

Categorically, townhomes, apartments, and ranchers moved a bit quicker than the other categories, not surprising with the downsizing and in-migration trends. The sell/list ratio fell within a band of 2.2% for all categories, again, remarkable consistency.

Examining price categories, somewhat surprising was that the over $750,000 category had the lowest days on market for June. Not surprisingly, the $300,000 - $500,000 was also at the lower end of the spectrum, albeit just a few days less than the other categories. Again here, the Sell/List ratio fell within a 1.65% band. All things considered, with the noted consistencies, it appears at each price point the demand and supply are relatively in balance. In other words, while there are more buyers in the 300,000 - $500,000 range, there are also more listings to satisfy greater demand.

Based strictly on this information, it appears market conditions are currently fairly consistent across real estate categories and price ranges.

Top Performing Neighbourhoods & Categories

13 of the 18 sub-areas defined by the real estate board in Nanaimo saw an increase in the average selling price (trailing 12 months) from May to June, with 16 of 18 experiencing increased prices year-over-year.  These annual increases range from 0.08% to 23.53%. Top risers month-over-month were Extension, Lower Lantzville, South Jingle Pot, Departure Bay, and South Nanaimo. Top performers year-over-year were Hammond Bay, Lower Lantzville, Extension, South Nanaimo, and Chase River. Looking at volume, risers both monthly and annually included Uplands, South Nanaimo, Extension, Central Nanaimo, and Pleasant Valley. One notable observation is that volume increases have been most prominent in historically lower priced neighbourhoods, likely as a result of buyers being priced out of more historically in-demand neighbourhoods. This is textbook market action for a maturing real estate market, as many buyers have now been priced out of the traditionally more in-demand neighbourhoods and are forced to expand their search to find a home in their price range. While buyers may be quick to justify their purchases, these neighbourhoods have been the last to rise for a reason and will often be hardest hit when an inevitable correction occurs. This makes it vital for buyers to be working with an experienced realtor who will be able to steer you clear of areas to avoid. While the headlines paint a fairly rosy picture, year-over-year price movements when broken down by neighbourhood range from -5.59% to a high of 23.53%. With real estate market action being location sensitive, it is vital to know what is going on in your area when determining whether the timing may be right to sell your home.

On rising volume, townhouses were the runaway leader in both average month-over-month and year-over-year increases. Patio homes and waterfront homes also fared well. Not surprising given demographics, the surge of mainland buyers moving here to retire, and the mass downsize we are poised to experience as baby boomers trade in their McMansions for a simpler lifestyle and a more enjoyable retirement.

Here is an excerpt from our 2017 Forecast posted as we entered 2017: Current market conditions present an excellent opportunity for those looking to downsize in the coming years to lock-in their recent gains and secure an ideal retirement home before masses go into competition and bid up prices on patio homes and ranchers in the next decade.

Market action so far in 2017 has supported this prediction.

Opportunities

We remain undoubtedly in the midst of a SELLER’s market. We see the opportunities firmly on the sell side. If you have previously listed a property that didn’t result in a sale, now may be the perfect opportunity to re-enter the market. Prices have risen dramatically of late so there is a strong chance that you would be able to list for more than you had previously and arrive at a sale in a timely fashion.

On the buy side, finding a “diamond in the rough” or scoring a “good deal” has been nearly impossible in 2017 with so many buyers actively watching the market. We’ve noticed as we head into summer holidays with the great weather of late that we have been able to secure accepted offers for buyers on a few properties that seem like exceptional value. Basically what has happened in a few cases is realtors are pricing below market value in hopes of drawing in multiple offers with the intention of having buyers become emotionally attached to a property and then bidding it up well in excess of the market value. So when all the buyer are at the beach and no offers come in, sellers get nervous, and properties can transact below market value. Make sure you are working with a realtor who is on the ball to catch these rare opportunities, you have to act quick.

For a consultation specific to your situation, or if you have any questions about market conditions, please contact us at info@jahelkagroup.com and we would be happy to help.

Check out the Nanaimo Market Statistics Here: Monthly Statistics Nanaimo June 2017

Source: VIREB

June 2, 2017

Monthly Statistics Nanaimo: May 2017


Market Strength Continues on Reduced Volume

Single Family Prices and Volume

178 single family homes sold in May, down 15% from the 210 sold in the same timeframe last year, but up 28% from the 139 that sold the previous month. Last year, volume peaked in May, so it will be interesting to see how volume progresses this year considering the excessive pent up demand. The average home price jumped almost 6% month-over-month to $526,234, which was an increase of nearly 17% year-over-year. If you’ve been following our commentary for a while now, you’ll be well aware that the average price isn’t the only determining factor in assessing the strength of a market. The median sell price is relied upon as a secondary measure which will not be skewed by a few high-priced homes selling at the top end of the market. May’s median price of $480,000 mirrored April’s levels, however, this figure represented a nearly 19% increase from the same period last year. With the spread between the median and average price again widening, we interpret this as a signal that properties at the higher end of the market are seeing more action. Watch for price action in the coming months to substantiate whether this is the case.

Strength of the Trend

Factors we also look at when analyzing a market to validate its strength are sell/list ratio; sell price; days to sell, and current inventory numbers:

The sell/list ratio moved upwards to 70% in May from 62% in April, but down from the 76% posted in May of 2016.

For the homes that did sell, the sell price/list price remained at 100%, up 1 point from 99% in May 2016. May’s figure is not suggesting every home is selling at 100% of the asking price as it is just an average, with some selling well below asking, and the most attractively priced offerings going into multiple offer situations and selling well above the list price in many cases. For a general frame of reference, typically anything 96-97% and above reflects strong market conditions.

The average number of days on the market decreased nearly 6% month-over-month to 16, down 41% from a year earlier. Taken together with a 100% sell price/list price, these figures suggest that buyers continue to take aggressive action to avoid missing choice opportunities. This number would potentially be even higher if it was not for sellers holding off on reviewing offers for a few days to ensure ample exposure for their listing in an effort to drive multiple offer situations.

As of the end of May, the number of active listings is 297, up 7% from April, but down 4% from the 310 listed at the end of May last year. There were 256 new listings in May, which is down 7% from last year’s figure of 275 for May.

With strong buyer demand, rising average prices, a respectable sell/list ratio, the average sell price/list price at 100% and the average number of days on the market at cycle lows, all signals are suggesting that one could reasonably expect continued competitive market conditions for the foreseeable future.

Only Found Here

Days on Market:

  • Selling in 0 - 7 days:
    • Single Family: 60% at an average of 102.65% of the list price.
    • Condo/Strata: 56% at an average of 102.30% of the list price.
  • Selling in 8 -31 days:
    • Single Family: 26% at an average of 98.42% of the list price.
    • Condo/Strata: 30% at an average of 98.10% of the list price.
  • Selling in more than 31 days:
    • Single Family: 14% at an average of 98.18% of the list price.
    • Condo/Strata: 14% at an average of 99.89% of the list price.

Sell Price/List Price:

  • Sold above list price:
    • Single Family: 32% of homes sold above the asking price - at an average of 5.82% above ask, with 18% the highest premium paid. The average days on market for those selling above the asking price was 3.65.
    • Condo/Strata: 30% of condos sold above the asking price at an average of 5.4% above ask. The highest premium paid was 18%, and the average days on market for those selling above the asking price was 7.69.
  • Sold at the list price:
    • Single Family: 23% of homes sold at the ask price in an average of 15 days.
    • Condo/Strata: 33% of condos sold at the ask price in an average of 16 days on the market.
  • Sold below the list price:
    • Single Family: 45% of homes sold below the list price, taking an average of 21.6 days.
    • Condo/Strata: 37% of condos sold below the list price, taking an average of 22.81 days.

There are clearly some key take-aways here:

  1. Premiums paid to secure accepted offers, in other words how far above the list price buyers are having to go to win bids, are increasing for both homes and condos.
  2. Homes and condos priced accurately are selling very quickly, in many cases at above the asking price.
  3. If a home has not been priced accurately and has not sold within a week, the market appears to be moving on with the average days on the market jumping, in some cases drastically.
  4. There is a strong correlation (or inverse relationship if you would like to get technical) between days on market and sell/list price. In general, the lower the days on the market, the higher the price relative to list price. Homes selling well below the asking price (that were overpriced by greedy sellers with unrealistic expectations) are sitting on the market for a significant amount of time as the seller’s expectations normalize over time.

What this means for Buyers: If you are a serious buyer, you need to be pre-approved for a mortgage and very clear on what you are looking for so that you can offer immediately on the best new options hitting the market.

What this means for Sellers: You need to price accurately to maximize interest. This is not the “leave a little room for negotiation” market. Pricing accurately will minimize the days on market (and inconvenience to your family), as well as best position you for a competitive bidding situation as evidenced by 32% of single family home and 40% of condo/strata sales in May transacting above the asking price. Working with a Realtor with a very strong marketing platform and one who employs effective strategies to drive and manage multiple offers is vital on the sell side. While the exact number is not known, the number being thrown around in the industry is that around 30% of accepted offers in multiple offer situations are falling apart. Make sure your Realtor has a proven ability to help you select the transaction most probable to complete. While the highest price often seems the most attractive, if it doesn’t complete due to financing, buyers remorse, etc., it is as good as useless and you will have killed the momentum with buyer interest. The right Realtor will help limit your risk exposure in this area.

Top Performing Neighbourhoods & Categories

15 of the 18 sub-areas defined by the real estate board in Nanaimo saw an increase in the average selling price (trailing 12 months) from April to May, with all 18 experiencing increased prices year-over-year.  These annual increases range from 6.28% to 33.41%. Top risers month-over-month were Upper Lantzville, Lower Lantzville, Extension, Uplands, and Pleasant Valley. Top performers year-over-year were Old City, Pleasant Valley, Lower Lantzville, Chase River, Cedar and South Nanaimo. As has been the case the last few months, it is interesting that both of these lists were absent of the consistent top performers (North Nanaimo, Hammond Bay, Departure Bay) from the earlier stages of the current cycle. Looking at volume, risers both monthly and annually included Uplands, Old City, Hammond Bay, Chase River, and Central Nanaimo. Two key observations remain consistent with those noted the last few months. Firstly, most price and volume risers are the traditionally more affordable neighbourhoods. Secondly, most of these neighbourhoods are near the city limits or in the cases of Cedar and Lower Lantzville, technically beyond. This is textbook market action for a maturing real estate market, as many buyers have now been priced out of the traditionally more desirable and/or more conveniently located neighbourhoods in relation to jobs and amenities, and must head further and further out to find a home in their price range.  With real estate being location specific, it is vital to know what is going on in your area when determining whether the timing may be right to sell your home. For buyers, neighbourhoods will experience differing price action throughout the cycle. Again, it pays to know what is happening in each sub-area, to determine whether a purchase or sale would be prudent.

On rising volume, apartment-style condos were the top performing category in May, followed by lots and single family homes.

Opportunities

With the market conditions only strengthening, we are in a SELLER’s market. The opportunities undoubtedly are on the sell side. With approximately 32% of homes selling above the list price, there has never been a better opportunity for sellers for a quick sale at top dollar. If you have previously listed a property that didn’t result in a sale, now may be the perfect opportunity to re-enter the market. With prices rising rapidly, there is a strong chance that you would be able to list for more than you had previously and arrive at a sale in a timely fashion.

For investors, could there be a momentum play to jump into the market for a quick flip? It looks that way. Would we recommend it...No, not our style. It is always important to protect your downside. To buy a negative cash-flow property and bet on appreciation is a risky proposition. Your only guarantee is you will lose a few hundred dollars every month. If you can locate a positive cash-flow property and you are comfortable holding on for a while if market conditions reverse, that is a different story.

For a consultation specific to your situation, or if you have any questions about market conditions, please contact us at info@jahelkagroup.com and we would be happy to help.

Check out the Nanaimo Market Statistics Here:  Monthly Statistics Nanaimo May 2017

Source: VIREB

May 24, 2017

Investor Insights


A Secondary Suite: Is It Right For You?


For investors, purchasing a home with a secondary suite can be the difference between a property cash flowing and not. For buyers wanting to get into the most desirable neighbourhoods, purchasing a home with a secondary suite may be the only way to do so without excessive pressure on the household finances as secondary suites are becoming more of a necessity in order to assist buyers in covering their mortgage payment where housing prices are often beyond the grasp of the majority of buyers. With vacancy rates sub 2% and rents on the rise, buying a home with a secondary suite seems to be making more and more sense...or does it???

Firstly, there is no concrete answer, as each buyer will have unique circumstances that will ultimately determine whether purchasing a home with a secondary suite is right for them. While I am a numbers guy and the numbers typically support the virtues of a secondary suite, what I want to primarily focus on today are some of the other considerations you will need to take into account. I have a fair amount of personal experience with secondary suites:  I have owned and rented both units in a suited home; I have lived in the main part of the home and rented the suite; I have lived in the suite and rented the main part of the home, and I have also rented a basement suite living below the landlords.

Is It Legal?Prior to 2005, secondary suites were not legally allowed in Nanaimo. Despite this fact, there were many secondary suites in existence that had not been constructed under a building permit. In order to address this, the city now uses a number of classifications for suites, depending on the circumstances:

  • Illegal: Not constructed under a building permit
  • Authorized with a notice on title: Existed prior to 2005 and upgraded to address life-safety issues through a Building Permit
  • Legal: constructed after Feb 7, 2005 under a Building Permit
  • Legal with a notice on title: If a suite was constructed after Feb 7, 2005 under a Building Permit within a basement that was not finished with a Building Permit

For suites that existed prior to 2005, in order to become authorized, consideration will be given to the following: the heating system and whether it is interconnected, smoke alarms, ceiling heights, means of egress, fire separation between units, stairs, electrical system review, other obvious safety concerns.

A suite can exist in both the primary dwelling or in an accessory building, often referred to as a carriage house, as long as the zoning requirements are met. In the primary dwelling, a suite is limited to occupying a maximum of 40% of the dwelling with a maximum of 2 bedrooms.

If you are considering purchasing a home with a suite, make sure it is at least authorized if constructed prior to 2005 or legal if constructed in 2005 or beyond. The City of Nanaimo is currently reviewing illegal accommodation in the city. If discovered, the city could come knocking with a request to inspect the suite. The inspection will then likely produce a deficiency report which you will be required to address within a certain time frame before being able to continue to operate the suite. In this situation, especially in older homes, it doesn’t take long for the list of requirements to be addressed to add up to $10,000 - $20,000 or even more. If you are counting on the rental income and don’t have the cash to cover these upgrades, it can quickly become a pretty dire situation.  Recently realtors have been reporting that properties listed with unauthorized accommodation have caught the eye of the city, with letters requesting suite inspections received in the weeks following the properties being listed. To avoid being caught in a vulnerable situation with unexpected costs, rule out homes with unauthorized suites from your search.

Property Management: If both units will be rented and you intend to have the property managed, please be aware that most property management companies will not provide services for unauthorized accommodation. Suited homes often see significantly higher turnover than individual rental units whether that be single family dwellings or rental apartments. Advertising and screening tenants can be challenging and a time-consuming process. If you will be managing your own property, make sure you are well prepared to conduct ample due diligence, understand the tenancy laws in the province, and are prepared for the time commitment required to manage it.

PrivacyMake no mistake about it, sharing a home with someone will impact your personal privacy. Even legal suites built to code will often have noise issues where you can hear music, pets, conversations, and even arguments coming through the other side of the wall or floor. Similarly, sharing a yard can be a challenge. Sun tanning may not have quite the same appeal with your tenant possibly coming around the corner at any moment.

ParkingThe city regulations require 2 parking stalls for the main unit and a third off-street parking stall for the suite. However, even if you have a single occupant in your suite, what happens when they have people over to visit. For that matter, what happens if they have 10-12 people over to watch the game. Are they doing anything wrong? No...Is it impacting the parking situation and disruption in the neighbourhood? Yes.

Animals: While many landlords do not permit pets to live in their units, what happens if a pet temporarily visits? Is it reasonable to completely restrict a visitor from bringing a dog over? That is debatable. If pets are permitted, does the owner clean up their mess? Does a dog bark or cry when the owner is out? Do dogs on either side of the walls bark endlessly at each other? Again, many considerations when pets are involved that you may not be thinking about up front.

UtilitiesIf you are purchasing a home with a legal suite where utilities are separately metered, then you should be able to avoid utility related issues. However, if tenants are sharing heating, hydro, etc., then how are the costs divided fairly? What if all the hot water is constantly being used by one of the parties? Again, complications that could lead to disputes and excessive turnover of the units.

DisputesWhen 2 parties share a property intended to be for a single-family dwelling, whether legal or not, there is a heightened risk of conflict. Aside from the issues outlined above, there are countless additional reasons that disputes could arise. It is one thing when you are the landlord and you carefully screen your tenants, but when you are renting out a fully suited home and you have 2 separate parties living under one roof, the chances of them getting on each other's nerves leading to fairly rapid turnover is fairly strong.

Bottom Line: If a secondary suite affords you the ability to get into the market, buy in your favorite neighbourhood, or ensure your investment property cash flows, then you should strongly consider it. However, know that the added financial benefits that accompany a secondary suite more often than not will come with a cost. Whether the benefits outweigh the costs are up to you. But please, go in with eyes wide open so you don’t find yourself in a less than ideal situation.

For more information on secondary suite requirements in Nanaimo, click here.

If you are considering a home with a secondary suite for your primary residence or as a rental property, put our team to work for you using our experience and insight to navigate the pitfalls and help you locate a property well suited to meet your needs. Contact us anytime for your complimentary consultation at 250-751-0804 or info@jahelkagroup.com.

May 2, 2017

Monthly Statistics Nanaimo: April 2017


Market Strength Continues on Reduced Volume


Single Family Prices and Volume

139 single family homes sold in April, down 26% from the 188 sold in the same timeframe last year, and surprisingly down nearly 10% from the 154 that sold the previous month. The average home price dipped slightly, coming in at $497,224, down 1.09% from last month’s average, but still up nearly 14% year-over-year. If you’ve been following our commentary for a while now, you’ll be well aware that the average price isn’t the only determining factor in assessing the strength of a market. The median sell price is relied upon as a secondary measure which will not be skewed by a few high-priced homes selling at the top end of the market. April’s median price of $480,000 eclipsed March’s levels by merely $100, however, this figure represented a nearly 23% increase from the same period last year. We interpret more movement in the median than the average price as a signal that prices for homes at the low end of the market continue to accelerate. With average household incomes in Nanaimo no longer qualifying families for high ratio mortgages at average sale price levels, one could reasonably expect continued competitive market conditions on the back of heightened demand in the lower end of the market for the foreseeable future.

Strength of the Trend

Factors we also look at when analyzing a market to validate its strength are sell/list ratio; sell price; days to sell, and current inventory numbers:

The sell/list ratio moved downwards to 62% in April from 77% in March, and down from the 79% posted in April of 2016.

For the homes that did sell, the sell price/list price remained at 100%, up 1 point from 99% in April 2016. April’s figure is not suggesting every home is selling at 100% of the asking price as it is just an average, with some selling well below asking, and the most attractively priced offerings going into multiple offer situations and selling well above the list price in many cases. For a general frame of reference, typically anything 96-97% and above reflects strong market conditions.

The average number of days on the market decreased 32% month-over-month to 17, down 35% from a year earlier. Taken together with a 100% sell price/list price, these figures suggest that buyers continue to take aggressive action to avoid missing choice opportunities.

As of the end of April, the number of active listings is 277, up 13% from March, but down 2% from the 283 listed at the end of April last year. There were 225 new listings in April, which is down 5% from last year’s figure for April.  Given the limited supply and strong demand, it is no surprise that buyers continue to struggle to find suitable properties.

Only Found Here

Multiple Offers: In this section, we provide some insight into a sample of our team’s proprietary data analysis, as well as sharing how we make use of this information to formulate effective strategies for our buyers and sellers. With uber-competitive market conditions and multiple offer situations still dominating the headlines, this month we thought it would be timely to provide some insight into multiple offer situations happening in Nanaimo. The statistics provided focus on homes that sold above the asking price, so for the purposes of our analysis, these are assumed to have resulted from multiple offer situations. We’ve analyzed the 2017 statistics specific to single-family and strata (apartments/townhouses/patio homes), and the findings are as follows:

- Sales above list price: 224 or approx. 30%

- Average premium paid: 4.37%

- Largest premium paid: 22%

- 10% premium or more: 9 - approx. 4%

- Subject free offers: 36 - approx. 16%

- Average subject free offer premium: 5.42%

- Average days on market: 12

- Median days on market: 3

This is just a sample of some of the proprietary analysis we conduct when strategizing about how to best prepare our clients to be successful when bidding in multiple offer situations. We have also thoroughly examined the tendencies of competing agents, so we can advise our clients accordingly on how they can best position themselves for success. On the sell side,  information such as this is relied upon when helping our sellers position their homes to maximize their returns.

In multiple offer situations, it is vital that you are working with a Realtor who has a proven ability to successfully navigate multiple offer scenarios on both the buy and the sell side. On the sell side, experience is important to be able to determine the strength of the offer. Price is only one factor, so if there is a low probability of proceeding to completion, you have to factor this into your decision. Ask any realtor you are considering working with how many multiple offer situations they have been involved in this year, and more importantly, what the outcome has been. It will save you a lot of frustration in the long run.

Top Performing Neighbourhoods & Categories

16 of the 18 sub-areas defined by the real estate board in Nanaimo saw an increase in the average selling price (trailing 12 months) from March to April, with all 18 experiencing increased prices year-over-year.  These annual increases range from 5.57% to 33.10%. Top risers month-over-month were South Jingle Pot, Cedar, University District, Pleasant Valley, Central Nanaimo, and Upper Lantzville. Top performers year-over-year were Old City, Pleasant Valley, Chase River, Cedar and Lower Lantzville. As was noted last month, it is interesting that both of these lists were absent of the consistent top performers (North Nanaimo, Hammond Bay, Departure Bay) in the earlier stages of the current cycle. Looking at volume, risers both monthly and annually included Cedar, Chase River, and South Jingle Pot. There are two key observations here…Firstly, most price and volume risers are the traditionally more affordable neighbourhoods. Secondly, most of these neighbourhoods are near the city limits or in the cases of Cedar and Lower Lantzville, technically beyond. This is textbook market action for a maturing real estate market, as many buyers have now been priced out of the traditionally more desirable and/or more conveniently located neighbourhoods in relation to jobs and amenities, and must head further and further out to find a home in their price range.  With real estate being location specific, it is vital to know what is going on in your area when determining whether the timing may be right to sell your home. For buyers, neighbourhoods will experience differing price action throughout the cycle. Again, it pays to know what is happening in each sub-area, to determine whether a purchase would be prudent.

On lower volume, patio homes were the top performing category in April, followed by Townhomes. If you have been following our commentary, this should not come as a surprise as we have been suggesting the babyboomer and empty nester demand should propel these categories forward.  While lot prices pulled back slightly after a strong March, average lot prices were still up substantially (75%) from the average price last April.

Opportunities

We are in a SELLER’s market. The opportunities undoubtedly are on the sell side. With approximately 30% of homes selling above the list price, there has never been a better opportunity for sellers for a quick sale at top dollar. If you have previously listed a property that didn’t result in a sale, now may be the perfect opportunity to re-enter the market. With prices rising rapidly, there is a strong chance that you would be able to list for more than you had previously and arrive at a sale in a timely fashion.

On the buy side, we see the residential market as a crowded space. If you are a bargain hunter looking to buy low and sell high, you should probably be considering other locations, as Central Vancouver Island has never had so much buyer demand competing for too few properties. For investors looking to diversify, one area that may be worth a look is an investment in commercial real estate. The commercial market traditionally lags the residential market, and while the residential market has gone crazy, commercial real estate has remained relatively subdued. As our population continues to grow with baby boomers increasingly choosing Central Vancouver Island as their retirement destination of choice, the need for service based businesses to meet the needs of the growing population is only poised to increase. More businesses equal more commercial real estate required. As we are seeing in the residential market, increased demand moves the pricing needle upwards. Commercial also seems to intimidate most residential investors, so competition is limited. Just some food for thought. Our team’s commercial real estate specialists are here to assist you in determining whether an investment in commercial real estate could be right for you at this time.

For a consultation specific to your situation, or if you have any questions about market conditions, please contact us at info@jahelkagroup.com and we would be happy to help.

Check out the Nanaimo Market Statistics Here: Monthly Statistics Nanaimo April 2017

Source: VIREB

April 6, 2017

Investor Insights


Real Estate or Securities? Where to Invest...

It seems that the debate about which asset class is a better investment has raged on for decades. At different stages in the market cycle, sentiment shifts and money shifts from real estate to securities, and then again more money flows back into the real estate market. Ask someone who bought waterfront property in West Vancouver a few decades ago for what now seems like pennies on the dollar or someone who invested early in Apple shares and you will likely get very compelling and well-supported arguments for where you should be investing your money.

Ask a stockbroker which is the better investment and 9 out of 10 times you know what you are going to hear. Similarly, ask a Realtor where one is best to invest their money, and again, the Realtor is likely to promote the asset class that, via commission income on your investment, is putting food on the table and their kids through college. Both may wholeheartedly believe in the asset class they are recommending, but they are biased, they have a vested interest, and they are immersed in their specific field, witnessing the successes of the clients they are working with on a daily basis.

Given my unique background where I have spent a significant amount of time in a licensed capacity advising clients on both sides of the fence,  I am often asked for my opinion on what I feel is a better investment. To be completely honest, my answer may surprise you...The better investment is the one that makes the most sense for you given your unique circumstances, investment objectives, risk profile, time horizon, market knowledge, skill set, etc.

I know, I know, that is a pretty weak answer. But, it is the truth. At the end of the day, whether it is a single-family rental property, an apartment building, a commercial plaza, a balanced mutual fund, or a speculative penny stock, all of these are simply tools that you can use to grow your wealth and achieve your financial goals. No matter your circumstances, I strongly advocate a goals-based approach to investing, where you have to look at what you are trying to achieve, and then focus on which asset class gives you the best chance of doing so with the most reasonable risk/reward profile. For the majority of the population, they simply wouldn’t have the required knowledge to ascertain this on their own. This is why it is so important for investors to surround themselves with a qualified professional team who can provide sound advice and guidance to ensure you achieve your financial and lifestyle goals.

Let’s take a look at some of the primary benefits of investing in each category:

Real Estate:

-Leverage: Ever wonder why your banker will lend you 95% of the purchase price of your primary residence and currently only charge you 2-3% interest? You know those financial towers in Downtown Vancouver, Toronto, New York, etc., they are full of smart people who have determined it is a safe investment in an asset class that traditionally rises over time. Currently, lenders will provide up to 80% financing on investment properties. Looking at our most recent monthly market recap, the average home price in Nanaimo is up 17.5% in the past year. If you purchase a $500,000 dollar property, (roughly the average home price in Nanaimo currently), with 5% down as your primary residence, your $25,000 investment before transaction costs, taxes, etc., is up $87,500, a cash-on-cash increase of 350%. On an investment property with 20% down, your $100,000 investment is also up $87,500, a cash-on-cash increase of 87.5%. Of course, these are abnormally high returns, but 2-3% annually which could reasonably be leveraged 20x (based on 5% down) returns 40-60%. With 20% down, 5x leverage on 2-3% appreciation produces very respectable returns of 10-15%. If you have invested in a positive cash flow investment property, add this to your monthly return as well as increasing equity resulting from the mortgage paydown. Taken together, your cash-on-cash increase is likely outpacing a balanced portfolio of securities, especially considering the low interest rate environment we are currently operating in. While some investment brokerages offer margin accounts, the interest rates charged on borrowed funds are typically much higher, and it is challenging to borrow more than 50%.

-Control: When you buy a real estate asset, you have control over that asset and ultimately its financial performance. When you buy shares, you are betting on management’s ability to effectively manage the affairs of the company. Where this gets even more interesting is with income properties such as apartment buildings or commercial retail plazas. Essentially, these properties are valued based on capitalizing the Net Operating Income. In simplified terms, the value of income-producing real estate goes up or down depending on the financial performance of the building. Therefore, you have 2 options...Increase income or lower expenses to increase the value of the building. As an investor, that is within your direct control. For example, you purchase an older 12-unit apartment building in a great area that has been poorly managed and needs some basic cosmetic upgrades. For the purpose of illustration, the building is currently 75% vacant and average rents are $800 per unit per month. Starting with the vacant units, over the course of the next 2 years, you clean up the units and hire a new, pro-active property management company, resulting in the average rents rising to $900 per unit and you get the entire place rented out in line with current sub 2%  vacancy rates in Nanaimo. Your gross rental income has increased from $86,400 to $129,600. If operating expenses stay relatively consistent at 30%, you Net Operating Income (NOI) has increased from $60,480 to $90,720. Based on current capitalization rates (4.75%) and holding them constant over the 2 years, your initial purchase price based on how multi-family properties are valued was likely in the range of $1,275,000. Capitalizing your improved NOI results in an implied value of $1,909,000, an increase of $634,000 in addition to your positive cash flow and increasing equity from the mortgage pay down. Under this scenario, a budget of $10,000 per unit for a total of $120,000 is extremely reasonable. Net, that is a gain of more than $500,000. If you put 20% down, your $255,000 down payment has translated into a significant increase in building value, all carefully planned with a minor cosmetic upgrade and replacing management. Knowing local market conditions, you (or your professional team) should have been able to identify this opportunity a mile away…

-Tax Advantages: Don’t underestimate the value of the principal residence capital gains exemption in your wealth building strategy. In 2013 while still living in Vancouver and working in the capital markets, I was over visiting family and viewed a waterfront property on desirable Fillinger Cres. in the prestigious Rocky Point area of Nanaimo, which featured a 3,200 square foot home with incredible views and excellent beach access. The home was a foreclosure at the time and ended up selling for $466,310. Today that home would easily clear $1,000,000, probably a fair bit higher. This is less than 4 years ago folks. Had I purchased with 5% down and made this home my primary residence, my $23,300 down payment + closing costs & property taxes has me up more than $500,000 tax free.  That is more than a 20x return on which I will not be taxed. Now, say I sell that property and use the proceeds to purchase a $2,500,000 property with 20% down. Over the course of the next market cycle that property doubles in price which is not an unreasonable expectation given past performance. 7-10 years down the road, I sell that property for $5,000,000 tax free. While you do have mortgage payments to consider,  I have now turned a $25-30k initial investment into $5,000,000 tax free in 14 years. Depending on your living standards, you are basically set for life. While this example is a bit extreme, it does highlight the potential of using real estate to your advantage as a tool to achieve your financial goals.

Other notable advantages of real estate include: it is usually easier to understand; it is a tangible asset you can touch, see and reside in; and price action is location driven so by making smart investment decisions you can largely control your exposure to price volatility.

Securities:

-Liquidity: In most liquid securities, a simple phone call or click of a mouse will have your securities sold. Faced with an emergency or a great business opportunity you can generally cash out with ease, although your return will be dependent on current market conditions.

-Lower transaction costs: Discount brokerages have reduced commissions to less than $10 per transaction in many cases. You could sell $1,000,000 worth of shares and be charged less than $10 to do so. Real Estate commissions are typically based on a percentage of the sale price, so the higher the price of the home, the higher the fees.

-Less work: Investing in securities does not involve managing tenants, coordinating repairs, or cutting the lawn. While you can hire out these services, it comes at a cost. When you purchase securities, you can have well-educated, experienced professionals managing both your portfolio and the underlying assets they are holding.

-Diversification: A relatively small investment can have you invested in a balanced fund consisting of both debt and equity in a variety of sectors and geographic locations. The tech sector goes bust and in a well-balanced portfolio, you are relatively insulated. In the early stages of building a real estate portfolio, many investors have only 1-2 properties. Should the market turn in that specific location, the concentration risk is much higher.

-Unleveraged Returns: Without borrowing to invest, stocks over the long term have produced a higher annual return than houses. The Globe and Mail reported in 2013 that in the preceding 30 years, stocks returned on average 8.5%, in comparison to the 5.5% return on real estate. For those against the use of asset-backed debt, then a case could reasonably be made for securities.

In Summary:

For most people, both real estate and securities have a place in their overall wealth plan. With each category having both positives and negatives, it is important to remember that these assets are simply tools to help you achieve your financial and lifestyle goals. In order to achieve these goals, you first need a plan, supported by a professional team who understands the “tool box” and how the tools can best be utilized given your unique circumstances, investment objectives, risk profile, time horizon, market knowledge, skill set, etc.

If you are considering an investment in real estate or need some assistance in developing a plan of action, put our team to work for you. Contact us anytime for your complimentary consultation at 250-751-0804 or info@jahelkagroup.com

Note: Some of the above examples are over-simplified scenarios used for illustrative purposes only, ignoring factors such as transaction costs, carrying costs, taxes, etc. The discussion surrounding securities are in no way intended to be considered advice, recommendations, or any act in furtherance of a trade.  

April 5, 2017

Monthly Statistics Nanaimo: March 2017

Undoubtedly a Seller’s Market This Spring

Single Family Prices and Volume

154 single family homes sold in February, down 5% from the 162 sold in the same timeframe last year, but not surprisingly up 43% from the 97 that sold the previous month as we emerge from the traditional winter slowdown. For the second time in recorded history, and now in 2 out of first three months of 2017, the average sale price for a single-family home eclipsed the $500k mark. Coming in at $502,696, this figure was an increase of 1.35% from last month’s average, and more notably a 17.51% increase annually. If you’ve been following our commentary for a while now, you’ll be well aware that the average price isn’t the only determining factor in assessing the strength of a market. The median sell price is relied upon as a secondary measure which will not be skewed by a few high-priced homes selling at the top end of the market. March’s median price of $479,900 was up 3.2% from February’s levels, and up 20% from a year earlier. We interpret more movement in the median than the average price as a signal that prices for homes at the low end of the market continue to accelerate. With average household incomes in Nanaimo no longer qualifying families for high ratio mortgages at average sale price levels, one could reasonably expect there to be solid demand at the lower end of the market for the foreseeable future.

Strength of the Trend

Factors we also look at when analyzing a market to validate its strength are sell/list ratio; sell price; days to sell, and current inventory numbers:

The sell/list ratio moved upwards to 77% in March from 54% in February, but was down from the unprecedented 90% in March of 2016, a 25% increase from February of 2016.

For the homes that did sell, the sell price/list price ticked up 1 point to 100% from 99% in February, and 2 points from 98% in March 2016. March’s figure is not suggesting every home is selling at 100% of the asking price as it is just an average, with some selling well below asking, and the most attractively priced offerings going into multiple offer situations and selling well above the list price in many cases. For a general frame of reference, typically anything 96-97% and above reflects strong market conditions.

The average number of days on the market decreased a further 7% month-over-month to 25, and more notably was down from 39 days a year earlier. Taken together with a 100% sell price/list price, these figures suggest that buyers are increasingly taking aggressive action to avoid missing choice opportunities.

As of the end of March, the number of active listings is 245, up 2% from February, but down nearly 10% from the 271 listed at the end of March last year. The increase from February follows the typical rise in listing numbers heading into the spring months, however with depressed year-over-year figures, it is no surprise that buyers continue to struggle to find suitable properties.

Only Found Here

***New for 2017: In this section, we provide some insight into a sample of our team’s proprietary analysis data analysis, as well as sharing how we make use of this information to formulate effective strategies for our buyers and sellers.

Days on Market:

  • Selling in 0 - 7 days:
    • Single Family: 53% at an average of 101.04% of the list price.
    • Condo/Strata: 59% at an average of 102.32% of the list price.
  • Selling in 8 -31 days:
    • Single Family: 30% at an average of 100.15% of the list price.
    • Condo/Strata: 27% at an average of 100.01% of the list price.
  • Selling in more than 31 days:
    • Single Family: 17% at an average of 97.55% of the list price.
    • Condo/Strata: 14% at an average of 99.29% of the list price.

Sell Price/List Price:

  • Sold above list price:
    • Single Family: 40% of homes sold above the asking price - at an average of 4.24% above ask, with 13% the highest premium paid. The average days on market for those selling above the asking price was 14.24, although this was skewed by 2 that required 100+ days to sell.
    • Condo/Strata: 48% of condos sold above the asking price at an average of 4.18% above ask. The highest premium paid was 11%, and the average days on market for those selling above the asking price was 6.73.
  • Sold at the list price:
    • Single Family: 16% of homes sold at the ask price in an average of 18.55 days.
    • Condo/Strata: 19% of condos sold at an average of 15.67 days on the market.
  • Sold below the list price:
    • Single Family: 44% of homes sold, taking an average of 35.91 days.
    • Condo/Strata: 33% of condos sold, taking an average of 43.57 days.

There are clearly some key takeaways here:

  1. Following up on similar market action in February, demand for condo/strata properties appears to have caught up and in some cases, surpassed the competitiveness for single family homes. This is a marked change from 2016 when condo demand and price action still lagged single family home market conditions.
  2. Homes and condos priced accurately are selling very quickly, in many cases at above the asking price.
  3. If a home has not been priced accurately and has not sold within a week, the market appears to be moving on with the average days on the market jumping, in some cases drastically.
  4. There is a strong correlation (or inverse relationship if you would like to get technical) between days on market and sell/list price. In general, the lower the days on the market, the higher the price relative to list price. Homes selling well below the asking price (that were overpriced by greedy sellers with unrealistic expectations) are sitting on the market for a significant amount of time as the seller’s expectations normalize over time.

What this means for Buyers: If you are a serious buyer, you need to be pre-approved for a mortgage and very clear on what you are looking for so that you can offer immediately on the best new options hitting the market.

What this means for Sellers: You need to price accurately to maximize interest. This is not the “leave a little room for negotiation” market. Pricing accurately will minimize the days on market (and inconvenience to your family), as well as best position you for a competitive bidding situation as evidenced by 40% of single family home and 48% of condo/strata sales in March transacting above the asking price. Working with a Realtor with a very strong marketing platform is vital, as is working with an experienced negotiator who can guide you through a potential multiple offer situation.  

Top Performing Neighbourhoods & Categories

All 18 of the 18 sub-areas defined by the real estate board in Nanaimo saw an increase in the average selling price (trailing 12 months) from February to March, with all 18 experiencing increased prices year-over-year.  These annual increases range from 3.86% to 29.03%. Top risers month-over-month were North Jingle Pot, Cedar, South Nanaimo, Old City, Pleasant Valley, and Central Nanaimo. Top performers year-over-year were Old City, North Jingle Pot, Lower Lantzville, Cedar and Chase River.  It is interesting to note that both of these lists were absent of the consistent top performers (North Nanaimo, Hammond Bay, Departure Bay) in the earlier stages of the current cycle. Looking at volume, risers both monthly and annually included Uplands, Departure Bay, South Nanaimo, Chase River,  University District, Extension, and Lower Lantzville. There are two key observations here…Firstly, most price and volume risers are the traditionally more affordable neighbourhoods, supporting our inferences surrounding price action earlier in the report. Secondly, most of these neighbourhoods are near the city limits or in the cases of Cedar and Lower Lantzville, technically beyond. This is textbook market action for a maturing real estate market, as many buyers have now been priced out of the traditionally more desirable and/or more conveniently located neighbourhoods in relation to jobs and amenities, and must head further and further out to find a home in their price range.  With real estate being location specific, it is vital to know what is going on in your area when determining whether the timing may be right to sell your home. For buyers, neighbourhoods will experience differing price action throughout the cycle. Again, it pays to know what is happening in each sub-area, to determine whether a purchase would be prudent.

Lots were the top performing category in March, kicking off what is poised to be a busy spring/summer building season. The average lot price in Nanaimo was up more than 25% to $249,818, which also represents a 43% increase year-over-year, on volume more than double both the month-over-month and year-over-year figures. Last month’s leader apartment-style condos had another strong showing with prices up 22% month-over-month, 17% year-over-year on strong volume. If you have been following our commentary, this should not come as a surprise as we suggested last spring that while single-family home prices were taking off, condos were essentially late to the party, and still well below the peak levels of the last cycle.  

Opportunities

The sell price/list price and sell/list ratios continue to tick upwards, prices are rising, active listings are low, average days on the market is falling, and buyer demand is strong. We are in a SELLER’S market. What should you do in a SELLER’S market? I’ll give you one hint...It isn’t time to go shopping. However, of course, this doesn’t apply to everyone. Circumstances change; job transfers, marriages, divorces, births and deaths, the list goes on. People have valid reasons to both buy and sell at all stages in the cycle, we are simply trying to address where the most optimal opportunities lie given current market conditions. For those looking to downsize in the coming years to lock-in their recent gains and secure an ideal retirement home before masses go into competition and bid up prices on patio homes and ranchers in the next decade, current market conditions present an excellent opportunity.

We’ve used a similar example in past editions of our recap, however, we really want to hit this point home. Downsizing is particularly attractive right now at elevated price levels because you are better to sell high on the higher priced property and buy high on the lower priced property than sell lower, and buy lower down the road. For example, if you sell a larger home for $600,000 and buy a townhome for $300,000, you have an additional $300,000 to fund your retirement. If the market corrects 10% across the board, you now sell for $540,000, buy for $270,000 and have only $270,000 remaining to fund your retirement. It is also important to note that given the demographics, the buy lower option may never come.

We are by no means suggesting that now is the time to sell for everyone, because individual circumstances differ, as do investment objectives, etc. Remember, we all need a place to live and over time real estate generally appreciates. We just know there are peaks and valleys and we have every reason to believe we are closer to the peak than the valley.

For a consultation specific to your situation, or if you have any questions about market conditions, please contact us at info@jahelkagroup.com and we would be happy to help.

Check out the Nanaimo Market Statistics Here: Monthly Statistics Nanaimo March 2017

Source: VIREB